I have been screening nightly for a good RSI(2) setup. I have yet to find anything outstanding. However, ECA, while it is less than perfect, certainly makes an interesting chart for analysis.
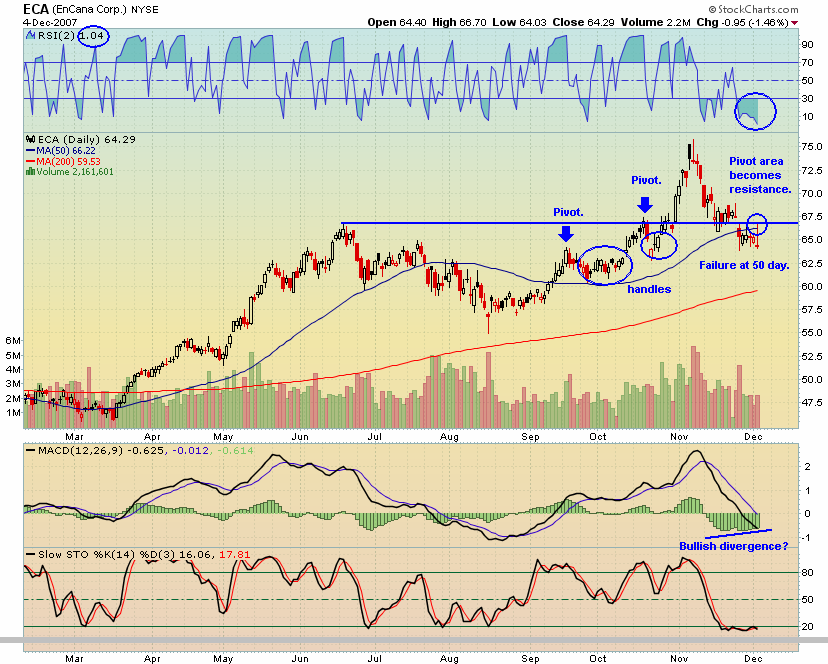
The stock made a well-formed cup, and then made its first handle in September and October. ECA then broke above its pivot, formed another short handle, and then screamed upwards.
However, we are less concerned with the breakout, and more concerned with how oversold ECA is. The RSI(2) is 1. Also observe the Stochastics. Looking at today’s candle, we can see that ECA tried to work off its oversold condition but met with previous resistance and the 50 day moving average. Normally a failure at the 50 day would open up the possibility for short selling. In this instance, it is hard to imagine this will continue downward without some sort of bounce or consolidation to work off the oversold status.
While this is not a perfect setup for the RSI(2), it does give one the idea of what to look for. We want a stock that has made a significant move up, and has then pulled back to either a trendline or moving average support, with RSI(2) < 2.
You can read the post that explains more about the RSI(2) here: Improving Your Timing with the RSI(2).


Yeah, this one looks tough…everything else besides RSI(2) says sell, sell, sell!
On the other hand, we haven’t seen RSI(2) this low since over a year ago. At that point it traded sideways for a month and then went up 10 points.
I would say we’re looking at something very similar. Might get a small bounce to correct some of this way oversold situation, but I don’t see the downtrend ending just yet…
This stock is at the whim of hat fucker arbs who play the inefficiency of the Canadian to American currency exchange with the ECA that trades in both NY and Toronto. Proceed knowing that.
Holy shit!
Jeremy put up an incomplete site.
Shocking!
I don’t know if I like this new format… kind of guilding the lily a bit with the giant numbers in the corner, and the boxes. I do like the alternative coloring, though.
Shed, whattup on the GES strategy… It may still be vulnerable at $48, I think…
This place looks like shit.
Where’s my gun?
I’ll be right back.
Shedder –
Ok, I am going to be the guinea pig here. I killed this morning on my early morning Yen shorts and Dow Futures long, so I shut down my futures terminals and now will go long ECA for an “Asshat of the Day” play. I am long 300 shares the equity with a 64.82 entry. My first target is 65.82 (peeling off 100 shares) and my second target is 66.32 (peeling off 100 shares). I will leave the last 100 open. My stop is below the most previous low – 63.50. My risk is $400. My reward on the first two lots is +$250 with the third lot open.
Fuick that back testing nonsense – I only believe in future testing.
I wish there was an edit button.
Wood! Are you shorting GES here or what?? I am extremly tempted….
ECA Target 1 (65.82) hit. Peeled off 1/3rd position. Moved stop up to just below low of day. Target 2 $66.32.
Jake, I have no position in GES and haven’t been able to watch anything today. I’d say a close beneath 50 day would make me want to short it.
Alvari, glad it has worked out for you. I’m glad my TA was somehow beneficial!
I’ll try and keep the charts coming!
Shedder,
I use pattern triggers on an indicator I got from Ratschke and it looks promising together with the 2 period RSI. Since I have shut down my futures charts and am concentrating on equities today, I have been doing my own scanning of the 2 period RSI and my indicator. I have OVTI as a trigger this morning. RSI spent 2 days below 1. Today it has a 3.5% pop. A bit too late for a day trade, but worth noting for the 2 period RSI record.
Alvari, OVTI made the screen the past two evenings, but I didn’t include it for a post here as I couldn’t find a corresponding moving average or trendline support for it.
Interesting, the Ratschke combo..
Shed, I thought you were short GES??
Anyway, take a look at RIMM … bombs away…
Jake, RIMM is juicy. Huge failure today.
I like this setup but would it kill you to increase the text size a little? I mean what is this, 4 point?
Mdawsz, evidently, I have little to no control whatsoever, of my own blog. I mean seriously, I only work here.
I just show up, and the whole thing is all fucked up and ugly.
Seriously, Jeremy works his ass off on ibank, so you might want to let him know about font and technical stuff.
Double seriously, I was not consulted about this format.
ECA – came within ticks of getting second target filled. Still holding 200 of the 300 shares with a stop at break even. RSI signal is still valid on the day chart, as is my independent signal to stay in this trade. Was a nice bounce off the 2 RSI. Carrying overnight.
This blog has been “un Pearl harbored.”
A regular bear cave this is.
I like that you took the advice to move the picture.
Now, get rid of the ad link horse shit, and you might be back on the road to respectability.
In the meantime, comparisons to AOL’s financial website are not out of the question.
CC in a serious downtrend, oversold condition has worked itself off today RSI 98.46. Price also butting up on 34 ema (daily chart). Seems to meet your criteria.
Nice peaks n valleys on RDY. RSI 98.97. At the top of peak.
Please notice the abundance of text link ads on non-Fly blogs, compared to mine.
Odd no?
Don’t get ya?
ECA play update:
Entry: $64.82
Target 1: $65.82 (hit yesterday). Peeled off 1/3rd position
Target 2: $$66.32 (hit this morning). Peeled off 1/3rd position
Target 3: Open Final 1/3rd
Stop: $64.82 on Final 1/3rd position
ECA play: Final Results
Entry: $64.82
Target 1: $65.82 (hit yesterday). Peeled off 1/3rd position
Target 2: $66.32 (hit this morning). Peeled off 1/3rd position
Move from open to close was +3.7%.
Shedder – you are definately better at techniques for short term trades than gaming overall market direction.
Target 3: $672.0 (closed out at the close today – Final 1/3rd position)
Alvari- nicely done. ECA still looks interesting.