Bud Fox, in the comments section, posted some tickers from the screen he ran based on the parameters from the Window Dressing post.
It should be noted that some of the tickers listed were inverse etfs. Obviously, we shouldn’t expect stocks in an uptrend to resume the uptrend while inverse etfs simultaneously go up. Anyway, some of the charts were interesting. Here they are, in no particular order.
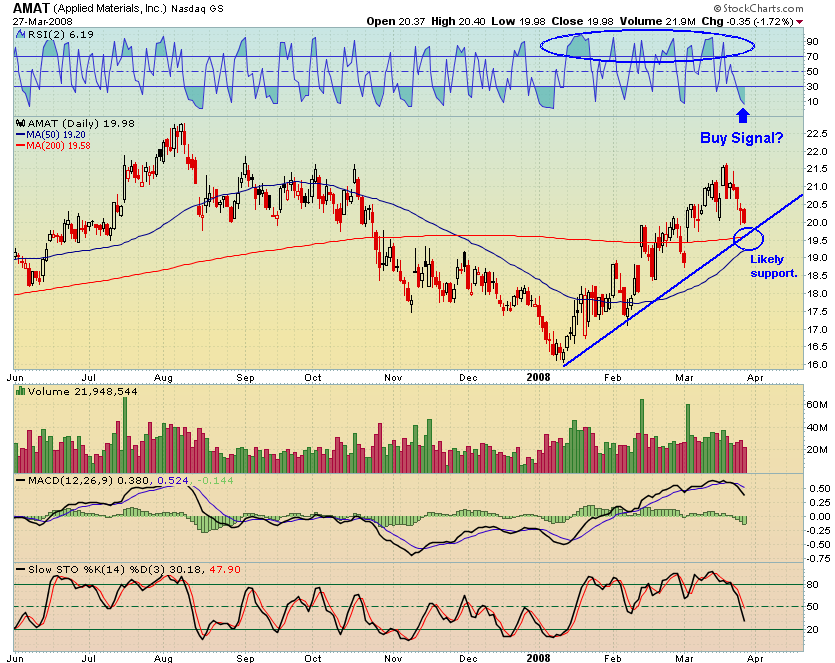
If the recent RSI(2) pattern holds, weakness tomorrow in [[AMAT]]Â should be bought.Â
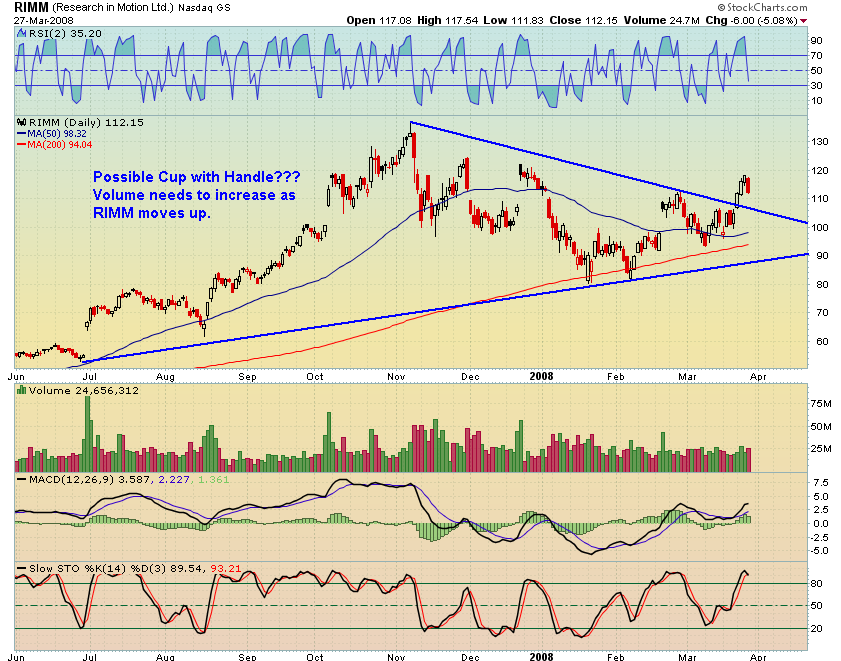
 I hate [[RIMM]], but the chart is compelling, save for the low-volume move up.
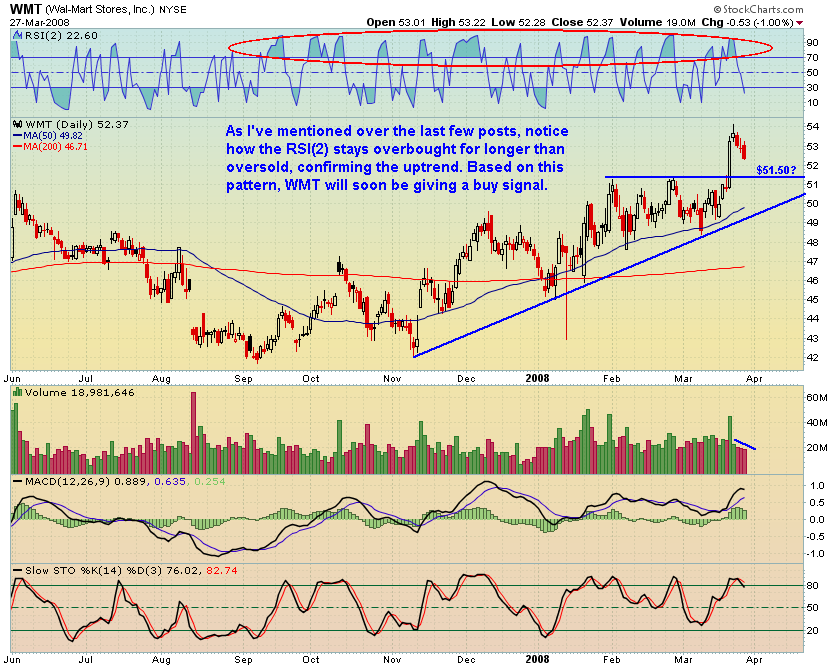
 [[WMT]] is also set up for a buy on any weakness tomorrow.


Technically the bears have a case for AMAT as well. MACD rollover & stoch trendline break.