I am going to put to rest these issues surrounding whether double inverse ETFs accurately track the underlying indexes.
Editor’s Note: Thanks to Ottnot, I have found that I have erred. I will strike through the errors, explain them, and re-post the corrected spreadsheet.
Here are the facts:
1. If the underlying index has a daily percentage gain, the double inverse ETF (diETF) will lose twice as much as the underlying index gained.
2. If the diETF experiences a one-day percentage loss, then the diETF can never ever recover to break even, relative to the underlying index it tracks. Not true. However, if the diETF experiences multiple days of losses or stays in a downtrend for a length of time, it can be very hard for it to recover to breakeven, relative to the index it is tracking.
Before I show why this is true, there are other issues to clear up. If we are talking about [[SRS]], the diETF for the Dow Jones US Real Estate Index, then we must compare SRS historical data to the historical data of the index it tracks, not to the historical data for another ETF, even though it may be tracking the same index. To compare ETFs to ETFs, instead of an ETF to the actual underlying it is tracking, will compound errors.
This experiment will compare SRS, a diETF, to the index it tracks, the Dow Jones US Real Estate Index, symbol DJUSRE.
Historical data for DJUSRE is available from Dow Jones here: DJUSRE Historical Data. Also, if anyone wants to perform more research on this subject, here is the Dow Jones Indexes website: Dow Jones Indexes.
I have pasted the spreadsheet below. I will do my best to explain what it all means.
*Note* Click on the spreadsheet once, and it will open in a new window. In the new window, click it again, and it will open full size.

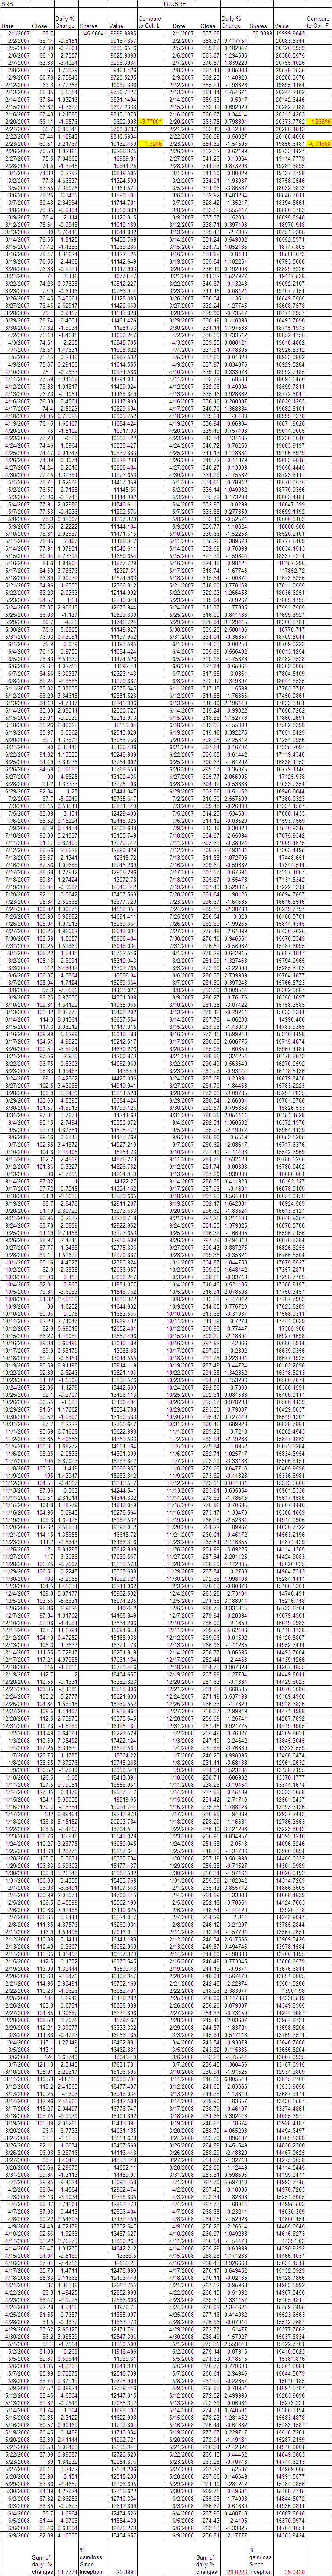
Column C has the daily percentage changes for SRS since inception. The sum of all daily percentage changes is 51.77
Column I has the daily percentage changes for DJUSRE during the same period. The sum of all daily percentage changes is -26.82
Ideally, 2(-26.82) would equal 51.77. Obviously it does not. We can see already, by summing the daily percentage changes, that SRS did not track the daily percentage changes of DJUSRE exactly, but this is a small error and is likely due to irregularities in maintainging the swaps and futures. This may also be due to management fees.
Next, look at the last cell in column E and K. This number is the percentage gain or loss since inception. We can see that SRS gained 25.39% over the period, while DJUSRE lost 39.04%Â Note to self, never ever build a spreadsheet after midnight. I copied the wrong formula over and therefore the sheet calculated an erroneous gain/loss since inception. The corrected numbers are 34.046% for SRS and -28.080% for the DJUSRE
Yes, that is correct. It is erroneous to assume that SRS would be +39.04%. It does not track the annualized percentage change of the DJUSRE, only the daily percentage change. Annualized, SRS has 13.65% less than twice the loss of DJUSRE. It is erroneous to assume that SRS would be +28.080%. It does not track the annualized percentage change of the DJUSRE, only the daily percentage change. Annualized, SRS has gained 5.97 percentage points more than double the inverse of the DJUSRE.
Finally, look at rows 15 and 18 in columns F and L. I have highlighted the cells. These calculations show that even over the short term, if the diETF goes down EVEN ONE DAY, IT WILL NEVER EVER BE ABLE TO GET BACK TO BREAK EVEN. The one known as “Ottnott” is right. Due to the 2x leverage, it will get back to breakeven, although if the losses are built during a sustained downtrend for the diETF, it may be very difficult for it to recover.
Let me explain. Look at the price changes from February 1 to February 23. During this time period, the DJUSRE value has moved up and down. On February 23, the DJUSRE index is almost back to breakeven. Cell L18 shows that the index has lost 0.71668% from Februrary 1 to February 23.
Now look at SRS during the same period. The closing price of the SRS is actually higher than the inception price, as it should be, since DJUSRE is showing a small loss, right? Be very careful here. While DJUSRE has lost 0.71668%, SRS has only gained 1.3246%, relative to its inception value. If we calculate twice the loss of DJUSRE on that date, we would get 1.43336% Observe that the gain of SRS is less than twice the loss of the underlying index.
From February 1 to February 23, SRS has actually lost 0.10876%, and it will never ever be able to make up that loss. In fact, these losses will compound over time. Had I not been in a hurry making the spreadsheet, I would have went ahead and completed the calculations for the entire row, instead of just a few cells. I would have then realized my error. What the spreadsheet now shows is that when there is no trend, or the diETF trend is down, the leverage tends to work against it. However, once a strong uptrend emerges for the diETF, the leverage really kicks in and it begins to outperform (more than 2x, annualized) the index it is tracking.
The key point to learn here is that it will take a while for the leverage in the diETF to catch it back up to the underlying. Even when the point value of the diETF is showing a gain, in percentage terms, the diETF may still be less than 2x the underlying.
These diETF are certainly great to trade on short time frames, but buying and holding them will guarantee losses. I still maintain that buying and holding the diETFs is a bad idea, due to the fact that any series of losses will compound and make it very hard for the diETF to recover. Furthermore, since most markets have an upside bias, over time, it is reasonable to assume that these diETFs can compound losses due to their 2x leverage to the extent that they may never be able to fully recover.
Please, if you have any questions about how this all works, do not hesitate to ask. I hope that now we can put this issue to rest, once and for all. Now that we understand how diETFs are born to lose, I suggest we begin to figure out how to profit from this anomaly.
I would also ask humbly that you link to this post, and pass it around, if you find it helpful. In my estimation, there is no other resource available on the internet that explains this diETF phenonmenon as well as this article.


really nice. get some sleep my friend.
Thanks Chivas…I really appreciate it.
I’m considering going to work late in the morning. I get up in 2 hours. Ouch. I’m a sucker for a good debate.
I also want to say sorry for the lack of TA posts of late. I just felt I needed to finish up this leveraged ETF issue.
Oh man, Fly is going to love this.
Nice work!
They do not ‘guarantee’ losses, but underperformance, relative to the index.
Fly, I will have to ponder that statement. Initially, I feel comfortable stating that buying and holding inverse ETFs will guarantee losses. However, I guess there could be a situation where an investor buys an inverse ETF at the exact right time, catches a multi-year trend, and doesn’t catch the wrong side of the percentage loss issue. I am curious what others think regarding that statement.
I tried to short FXP this am and ‘they’ wouldn’t let me. Fuckers. Can’t win.
Nor could I short SKF … the game is rigged.
great stuff.
I do think it’s fine to compare it to the ETF though, as that is essentially the tradable alternative. I realize not all *regular* ETF’s do what they’re supposed to do. But that’s a separate issue.
Adam, in reality, it essentially HAS to be compared to the ETF, in order to profit from the anomaly.
However, I believe it may be instructive to first figure out any divergences between the comparable regular ETF and the underlying.
Essentially then what we’d have is quantifiable divergences from the underlying index on both double inverse as well as the regular ETF. Knowing both these calculations should allow for development of a model, based on the movement of the actual index, DJUSRE, DJUSFI, etc.
This will all make more sense if you look at the logarithms. Take the log of the daily price changes and add all the values together. A round trip price change (a deviation in either direction that eventually reverses) will not have a total logarithmic change of 0. A 50% loss is reversed by a 100% gain.
This is the rebalancing cost of constant leverage. It is not a feature of the double leverage etfs, it is a mathematical property of fixed percentage investing. It is more noticeable when shorting with leverage than when going long with leverage.
You should be able to make money shorting the double and double inverse etfs because you collect the management fee. But you have to pay trading commissions daily, which may be more than the management fee.
On the other hand, daily rebalancing helps a lot when the market goes for a long trend. If the market drops 0.5% a day for thirty days, the total drop will be just under 14%, but the double inverse etf will be up almost 35%. If the market goes up 0.5% a day for 30 days, it will be up just over 16% and the double inverse etf will be down just over 26%.
What this all means is that the double leverage etfs will move more favorably when the market moves in the same direction for many days in a row and less favorably when the market reverses direction frequently. Since stock prices tend to be negatively auto-correlated, the double etfs will tend to fall short of their expectations more often than they will exceed them. In the long run, the double short etfs will go to 0. Over sufficiently long time periods, it is likely that the normal long etfs will outperform the double long etfs.
jkw- excellent points.
I tried to highlight in a previous post on this topic that the mathematical property is not just particular to the leveraged ETFs. I wasn’t clear about that in this post.
I keep hearing that if you short the diETF’s you will “gain the management fee,” but no one mentions that you will also lose (ie, “pay”) the dividend, if there is one. TWM and SKF both pay one, I think FXP does not, yet, at least.
__
So we can assume that even if we retest the March lows in FXI, FXP will not reach its highs of about 120 which were put in at the bottom of the FXI.
So the target for FXP would possibly be only as high as maybe 100 or so ?
ST Daddy, I think that is a safe assumption, although I am not gifted enough to hazard an estimate as to what the high in FXP might be relative to a re-test of March lows.
I have noticed with all ETF’s that discrepencies also arise due to a dividend payout.
If and when I have gotten caught in these products I try to look for a low point and triple down and get out on the next bounce.
Luckily I have not lost yet on these products.
they are great trading tools , but horrible long term plays.
I got caught in DXD for over a year before I got my money back. Luckily the market tanked fierce and I was adding along the road of pain.
Excellent study Wooshedder. Were you able to determine if there is a statistical edge to shorting the shorts or just going long for short-term swing plays?
Woody,
Great post. You should get a Digg button up… I’d Digg this shit for you.
-DT
There was a Seeking Alpha article some time ago that covered the same topic, tho not as well. Nice post, friend-o. You can keep the quarter…
bhh, that part is next. I wanted to first establish that there are anomalies to exploit.
DT- the button is there already. Thanks man. I need to come by and see if you’ve recovered…
Thanks Anton.
Todays performances:
NDX -2.44 QID +4.58
RUT -2.01 TWM +3.28
SPX -1.69 SDS +3.19
INDU -1.68 DXD +3.04
I don’t see any doubles in there.
Egregious.
Shed that was a great article that I’m sure you spent many hours on. For that I and others thank you. You should just make it a page for easy access.
I still remain in muted disbelief that this is a huge revelation.
Think like this…why even buy indexes in your IRA if you can buy ultras…why not buy ultra dow, sp, and qqqqs? WHy not hold them for 20 yrs and get better gains? Because they don’t work. That’s all anyone needs to remember.
This product was made so that proshares would have something to sell/collect mgt fees on. That’s probably it. They wrap it up to look like an amazing new product, so it has liquidity and is profitable for proshares. Maybe it was 20% altruistic and they knew people wanted an easy way to “hedge” trades.
In any event, I don’t believe they were ever meant to be an “investment vehicle” though they are deceptively marketed that way.
In a world of “no free lunch” why wouldn’t even a conservative investor go long ultras for 20 yrs? Why would 2x the gain, same price, ever yield more with less risk? How is it possible?
If the market return is 9% over say 30 year periods, why not hold these ultra ETFs for that time and get closer to 20?
Bc as shed proved, they don’t work.
Wood –
Making this post a page that’s easily called-up is a good idea. These things are great for a trade (I own a little FXP), but I think some people buy them for the wrong reasons.
At least if greed is a wrong reason.
Wood, please, I’m begging you. Stop making this incorrect statement:
Finally, look at rows 15 and 18 in columns F and L. I have highlighted the cells. These calculations show that even over the short term, if the diETF goes down EVEN ONE DAY, IT WILL NEVER EVER BE ABLE TO GET BACK TO BREAK EVEN.
That is wrong. Even when jkw pointed it out above, you missed it.
I’ll let your own spreadsheet show you. Do the column F and column L calculations for Feb 27 and Mar 5. Note that SRS has gained more than twice what the index has lost as of those dates.
If you don’t believe your eyeballs, create a column M, and fill the cells with the formula “=-F#/L#”, where “#” is the row. Scan for any rows where L is negative, indicating a loss to date in the index, and M is >2, indicating that SRS has gained more than twice to date what the index has lost to date.
When you have that column, you could chart that ratio against the movement in the index. I’d like to see that graphic.
Ottnot, with all due respect, you remain incorrect. You are talking about a points basis and not percentage terms.
Maybe someone else can explain it better to you than me. I’m off to work.
No, Woods. I’m talking percentage. All I’m asking you to do is to do the exact same analysis you did for the Feb 23 closing values – but using the Feb 27 or Mar 5 closing values. The exact same analysis.
I’m using your own spreadsheet, where you have % changes in columns F and L.
So, when I create a column M, to indicate the ratio between F and L, I’m comparing %s, not points.
I’m using a formula to make the exact same comparison you make in your post:
Now look at SRS during the same period. The closing price of the SRS is actually higher than the inception price, as it should be, since DJUSRE is showing a small loss, right? Be very careful here. While DJUSRE has lost 0.71668%, SRS has only gained 1.3246%, relative to its inception value. If we calculate twice the loss of DJUSRE on that date, we would get 1.43336% Observe that the gain of SRS is less than twice the loss of the underlying index.
Cripes. You have an enormous blind spot about this.
Ottnot, I will complete the calculations as you have asked as soon as I get home from work.
Thanks, wood.
I’ll take some leftover humble pie out of the freezer to defrost, in case I’ll need to eat some.
lol @ ottnott.
Regardless, the idea is to learn and grow, and no matter who is correct in this case, I think we’ve both learned a lot.
I learned nothing. I already new[sic] the ultras sucked ass. But I enjoy the debate. Actually, no, I hate the debate on ultras. They just suck. You guys are cool though…
If you go further back than just 16 months, like back to at least two two [sic] three years, I’d be interested in your findings.
Bottom line, I always understood it to be that when the market is bouncing around, range bound and more volatile than Amy Winehouse, the double inverse ETFs have a larger tracking error than when the market shows a steady trend. That’s the non-Einsteinian translation.
Your conclusion is correct based on your data, it’s just not conclusive for all time periods.
ADawg, most of the leveraged ETFs were introduced around 9/1/07. I went back as far as I could.
Whoops, 9/1/06, I meant.
Nice work. You must love doing the research.
alpha – that’s why I’m hoping wood will chart the ratio (diETF%change/index%change) against the index value.
It would be interesting to see what type of index movements have the biggest effect on the ratio.
ottnot, why don’t I just email you the spreadsheet, and you can fool around with it, too? It will have to be this evening.
I just created fromwoodshedder @ songwriter.net
Email away. No offers for pills or enhancers, please.
I disagree wholeheartedly with Danny’s analysis. He just hasn’t realized the milking potential of the DiETF’s yet.
Yes, they are more volatile, but that makes their options SO SO JOOZY (sic). So you sell the options every month. Sometimes you get stopped out, but it’s rare. People are always willing to pay you big coin when these things are running.
They are ATM machines, my young San Dieagan friend.
BTW — why aren’t you and Ott out at Torrey Pines watching the Mickey and Woodie show?
_
Stop the debate.
I don’t know what the outcome will be if you correct this, but Wood, your analysis has one fatal flaw.
Simply summing the daily percentage returns is incredibly inaccurate — the longer period of days that one sums, the worse the figures diverge from a true “Time Weighted Return” that (crucial) includes compounding.
The formula to accomplish that is:
((1 plus PreviousCumulativeReturn)*(1 plus CurrentDayReturn) ) / 1. Of course the first day’s cumulative return is the one day % change number. I will send you an existing spreadsheet with these calcs (on different data) if you like.
I am an RIA and use this exact formula (based on monthly figures adjusted for deposits/withdrawals) in my client reporting calculations, which get audited by securities regulators. They aren’t as accurate (like to the day) as paying $100k/year for Advent Axys software will get you, but the concept is absolutely correct.
Summing is only valid for back of envelope purposes, not like your study where there are many items in the series.
I’m curious to see how the results look with this simple correction.
PS to webmaster. the plus sign would not submit, so i came back & made it a word.
Buck, I’m not sure that I want a Time Weighted Return. The prospectus for SRS is clear that it seeks to match 2x times the inverse of the DJUSRE on_a_daily_basis. The calculation should start over every day, and shouldn’t be influenced by any amount of time over 1 day.
I’m not saying it shouldn’t be figured the way you suggest, I’m just saying, for my purposes, I think it calculates exactly what I want.
That being said, I will run the calc as you suggest, but I would appreciate if you would educate me on why a time weighted calc is important, and what it accomplishes.
Quite the slap fight you’ve started, Woody. Everybody please stop before somebody breaks their pocket protector.
Oh, and Woodshedder is righteous as a motherfucker. Which is pretty righteous.
lol @ Anton. I haven’t worn a pocket protector in like 3 days.
HA! Hey, Woody, you know the only thing missing from your post and follow-up discussion? I gay math/finance 101 lecture from that douche bag, ducati. Then it would be P-E-R-F-E-C-T.
Wood,
When calculating time-weighted rate of return, the effect of varying cash inflows is eliminated by assuming a single investment at the beginning of a period and measuring the growth or loss of market value to the end of that period.
jog on
duc
Ottnot is correct. After going back over the spreadsheet, I have found how I have erred.
Major retraction will be published within 24 hours.
Duc, so then I do not need to calculate the column as Buck has suggested as there are no cash inflows.
HA! Hey, Woody, you know the only thing missing from your post and follow-up discussion? I gay math/finance 101 lecture from that douche bag, ducati. Then it would be P-E-R-F-E-C-T.
Hahahaha!
Fuggin’ Jeremy, messin’ with the time-space continuum again.
(What I wouldn’t give for those powers!)
_
Fuck.
Duc: One thousand apologies. I saw the timing of your post as the opportunity for a cheap-ass joke. (Funny as hell at the time to me, fucktard that I am.) A failure of character. Please forgive. Or don’t. Nice add, tho.
Ott: Fine and passionate work. Thank you.
Wood: I will find the SeekingAlpha article I referenced. I am on the links at dawn with a client, so it will be late. But your conclusion is correct. Good work to be sure.
Woodshedder says, “Ottnot is correct. After going back over the spreadsheet, I have found how I have erred. Major retraction will be published within 24 hours.”
You are a more righteous motherfucker than ever. Thank you.
This is why I seek to employ & promote math and finance geniuses; I am not one. Thanks to everyone who posts here. Except my fellow mongoloid fucktards.
Kisses. Goodnight.
UPDATE:
It’s safe to buy SRS again.
Shed you just got majorly owned.
Danny, I do recall you reading through the whole thing and agreeing whole-heartedly with it.
Shed.. comparing SRS and the Index the same way does keeps things apples-to-apples for the sake of your comparison, so it’s fair in that way.
but to measure the true returns of anything over time — even without any cash in/out flows like Duc mentioned — TWR gives you a true picture while addition will not.
take this example. period can be day/week/month/doesn’t matter.
Period 1: Trader makes 100%.
Period 2: Trader loses 50%.
by summing, that trader is up 50% — while in reality he is breakeven.
these distortions happen because it always takes a few more basis points worth of upside performance to make up the same percentage loss. like if you lose 20%,it takes 25% gain to get back to breakeven.
the formula, which i posted wrong initially:
((1 plus PreviousCumulativeReturn)*(1 plus CurrentDayReturn) ) minus 1
previous cumulative when you start is obviously zero.
end of Period 1: ((1 0)*(1 1.0) ) – 1 = 1.0 = 100%
end of Period 2: ((1 1.0)*(1-.5) ) – 1 = 0 = 0% (breakeven)
please refute my logic.
anyway, regardless of how you measure it, there’s also the issue of premium/discount. i would bet a ton o $$$ that the underlying swap contract that SRS is based on correllates 100% with the Index. it’s us traders that make it diverge from absolute true correllation.
Wood,
With regard to cash inflows, I have no idea whether that is true or false.
As previously mentioned, there are two sets of DERIVATIVES being utilised here;
*Swaps
*Futures
If they are not closing out the futures each day, then they will have cashflows based on closing prices. If they close, then there will be distortions due to new open/close positions
With the SWAPS, they in essence are a STRIP + Option
This will carry cashflows based on the above.
Look at the confusion surrounding just the initial basic question…you haven’t even scratched the surface of how these securities are managed via their structure.
There seemingly is no true arbitrage.
There MAY be a STATISTICAL arbitrage, but this carries quite substantial RISK
jog on
duc
Duc,
i understand every concept of the derivatives you mentioned and how d.i. funds have to be managed, but don’t have a clue what your point is.
if my last (blatantly obvious) post did not prove to you that summation is wrong and TWR is right for calculating returns over time, i have no idea what would. there were no cashflows in/out of any account in that example.
i’m defintely jogging on. for good on this topic anyway.
Good luck,
Buck
Buck,
My point is that there is no true arbitrage available, save for the already practiced traditional one twixt Futures and cash markets.
There may be a Pairs trade [statistical arbitrage] available somewhere, but these are not risk free trades.
I had [have] no argument with TWR as being appropriate. Thus it would seem that we are on the same page, more or less.
jog on
duc
Buck, a ha, I now understand! That TWR is a very neat formula I will certainly begin including it in future calculations. Thanks!
Shed, i can email you a copy of my primary Excel spreadsheet if you like. calcs all sorts of TWR goodness for my “model”/”typical” account (which is of course a real client account)..
just let me know, my email address gotta be in the IBC back-end blogging system..
long as you guys don’t spam me.. 🙂
I’ve got it buck. I’ll shoot you an email tonight. I really appreciate it. And if we do spam you, it will be with pictures of sexy French TV anchorwomen.
If u see the movement of SRS and Dow Jones Real estate index in last 3 months, we observe the following:
– While the DJ US Real Estate Index has moved up from 100 in 1st week of Nov 08 to 125 on 6th Feb 09
– SRS has moved from about 300 to about 55.
The following is not clear:
For a movement of 25% in Dow US Real Estate Index, how does the Double Inverse ETF move to about one sixth the value???