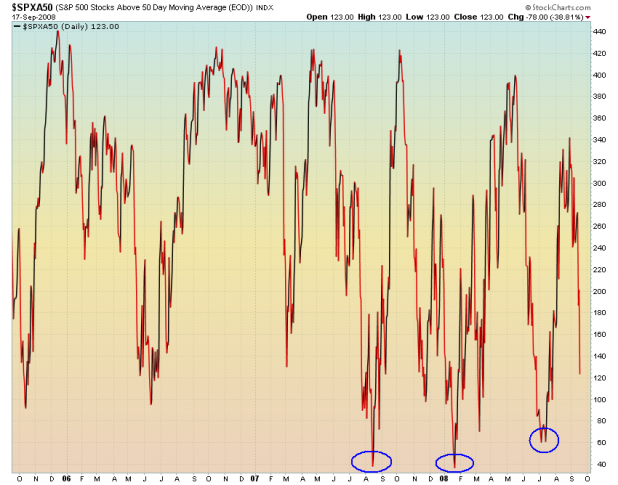
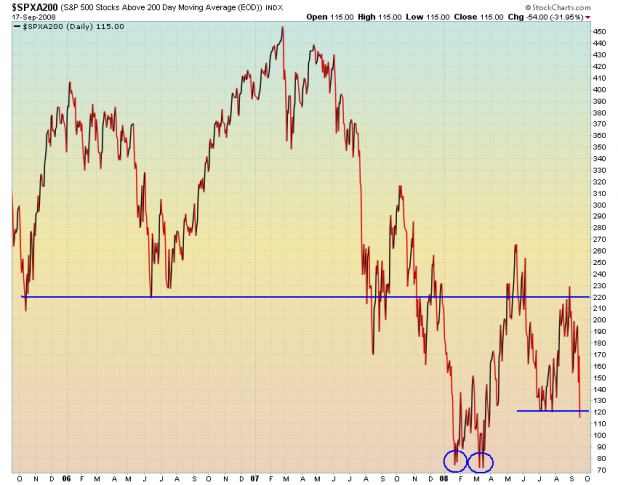
Last night, as I was in the middle of my analysis, I pulled up two charts: Number of SPX stocks trading above their 50 day averages, and number of SPX stocks trading above their 200 day averages. What I found was confusing and unsettling: Neither chart showed breadth to be even close to a bottom.
Keep in mind that Danny’s Legend of Vance Bagger indicator is derived in part from the number of stocks trading above or below their 50 day averages. It should make sense why Danny has almost been screaming that the bottom is not yet near.
It would have been very wise for me to delve into the unsettling feeling these charts gave me last night, as I would have likely postponed my “This Is A Tradeable Bottom” post ’til a later date. Alas, humility is good for the soul, but not as good for the account balance.
The chart above shows that 78 stocks on the S&P500 dropped from above their 50 day average to beneath the average. Should a similar number of stocks move below the 50 day tomorrow, this breadth indicator will register a level that existed during the August 07, January 08, and July 08 bounces. This is circled on the chart.
This chart is the number of stocks on the S&P500 trading above their 200 day moving averages. Last night it closed with near 150 stocks still trading above the 200 day, which was good enough for August 07, but not good enough for September 08. Today, the S&P500 had 54 stocks kicked beneath the bear market average. While this Summer found this breadth indicator reversing at today’s level, It appears to me that another 60 stocks need to get knocked down for this indicator to be near the January and March bounce levels, which are circled.
I do not currently have data for previous bear markets, for these two measures of breadth. They may have ventured lower than where they bounced in January, during previous bear markets.


I’ll put up links to those charts with more data from blocks
Put/Call ratios, TRIN, etc, are also not showing a bottom. Hard to gauge all of this, as we all know, but I think we are just starting to get into the public participation phase of the decline. Trader Joe is still trying to pick a bottom in LEH and AIG (not to mention pie in the sky penny stocks), and losing his ass, while Average Joe is wondering if his bank account and pension will be around next week.
Wow, that’s actually pretty interesting.
Ozark, the 52 Week High/Low ratio for all stocks in the universe has not yet reached January’s level. In fact, it actually improved today. Ridiculous.
If you are right about the average Joe, this will get much much worse.
I’m glad you feel that way Fly. It wouldn’t hurt if once or twice a year you became lazy and ignorant, if just for one night.
OEM Daily Summary:
“The credit crunch appears to have turned into a financial crisis. Support for the SPX drops to 1146 and then 1136, with resistance at 1168 and then 1179. Despite today’s drop short term momentum was barely oversold at the lows, and displaying a slight positive divergence. The near term indicators are making new lows. Tomorrow the weekly Unemployment claims at 8:30, and then Leading indicators and the Philly FED at 10:00.
Last week we mentioned that MER, C, LEH and WM, (in that order) had weak charts. LEH filed for chapter 11 Monday, and MER was merged in a stock swap deal with BAC Sunday. Now we can add WB and MS to our list of weak major financials to watch. The charts continue to support that Minute wave iii of Minor wave 3 has been underway since the SPX 1255 high last Friday. Not seeing the near term oversold levels for a typical Minute wave iii low, yet. Should occur soon though.”
Wood also check out the percentage ones. SPXA200R for example. Weekly looks bad, but there might be a bounce off the daily charts. There might be a strong bounce very soon, even tomorrow. Options look strange for financials, what do you think?
Fly, are you still in WB?
Wood, good stuff. Thanks. How far back is the breadth data available?
I saw a guy buy a million shares of LEH yesterday at 18 cents. He’s still holding. It’s not like he’s a millionaire or anything either; it’s nearly everything he has. Not too far removed from the guy that thinks he can get rich from the .0001 to .0002 spread on a fraudulent pinksheets that his coworker at the factory told him about.
And that is just the most egregious example so far this week. At this rate most fools will soon be separated from their money.
IMHO I think we all lose track of what the general public (poor dumb bastards) is feeling. We are all glued to our accounts. We dream about the shit. But I try to pay attention, and it seems like the fear and emotions are starting to build.
what an idiot.
out of WB.
Dammit shed, let my pictures through the spam filter.
Good work Shed, great chart and analysis.
About sentiment, I agree that the average Joe is just to really realize his retirement plans/ 401k account are going up in smoke.
The avg Joe found out last week when the qtrly reports for June were rec’d in the mail and he found out he was down 20% where my son works anyway. Of course he’s been entirely in cash since Dec. His fellow ees pop their heads into his office every day to see what the Dow is doing … they are now expecting another 20% shortfall for Q/E3 and many may be calling their funds now if they haven’t already. I think that may be contributing to the carnage along with the hedge fund redemptions … thanks to Fly for his “robbing Steve’s 401K” post for reminding me to have my son and “significant other” move from stocks to cash!
Hi Woodshedder,
To answer your question, I’m still looking to add an automated relative strength parameter, but am struggling on how to do it. I have looked at different time frequencies and exiting if a price moves above/below certain moving averages. I’d also like to measure a stock’s strength against the market. Basically though, I am kind of stuck on how to implement and am just waiting for some kind of divine inspiration to come to my aid.