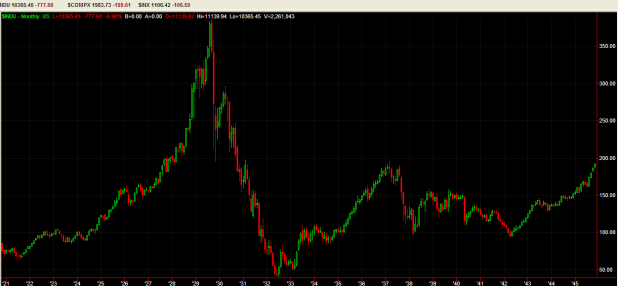
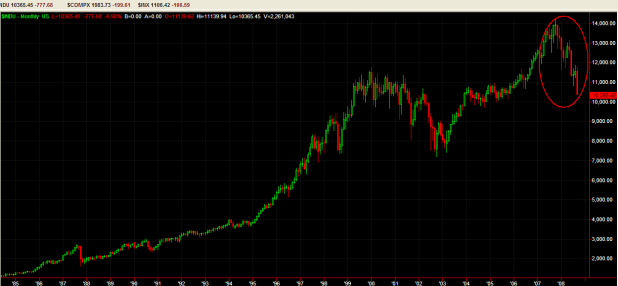
Comparing the current top (below, circled in red) with the 1929 top (above) clearly shows just how bad things can actually get. If we are to experience a prolonged meltdown, it appears the indexes have the potential to fall a lot farther than anyone is even imagining.
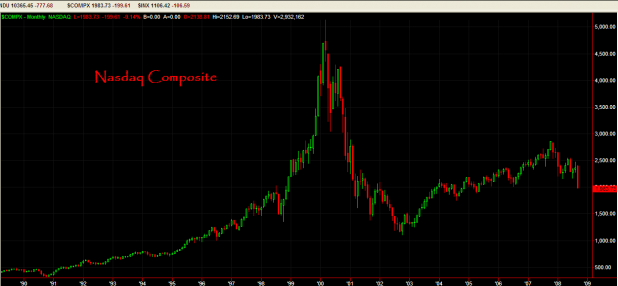
Update: I added the Nasdaq Composite chart at the very top as requested in the comments section.
From the top in 1929 to the bottom, the Dow Jones lost almost 90%. Were something similar to happen today, we would be seeing the Dow Jones print 1620.
Seeing a 50% drop from the October 2007 top seems more likely. I would not be surprised to see the Dow Jones print somewhere as low as 7,000-8,000.
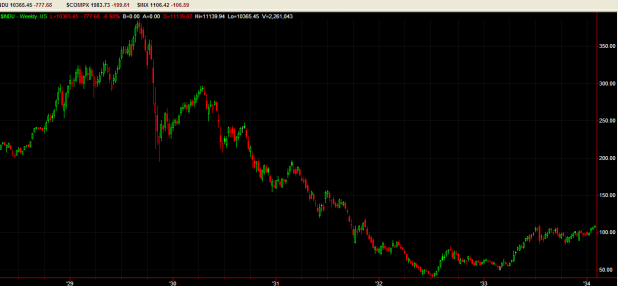
I included this weekly look at the Depression Top for some comparison to the current top. Again, current charts look like they still have a ways to go.


http://www.ibankcoin.com/peanut_gallery/index.php/2008/09/23/portrait-of-a-crash/
I’m waiting for a week of this before I revisit this post but please note at the end of it I said:
Start working out plans to ride some huge volatility spikes. Think 3SD at least if not more. Options are probably a good tool but I don’t know diddly about options.
When moves start approaching 500 points, sell into the rally and sit on your cash. That’s just my humble opinion.
A little something to cheer us up?
And for some reason my total rating on that post was 4.56
Hmph.
Now someone get Chivas up and ask him why he wanted to see these charts…
___
Woody,
thanks a million. one more thing please. use the comp for the bottom chart. 1995- present
Jake,
i will get to that.
Chivas, ok, gimme a sec.
Woody,
thanks, very similar right? % up % down time to top and time to bottom.
Chivas, I guess so? I’m not sure where you are going with this.
Truly hard to find knowledgeable persons on that matter, however you seem like you no doubt know what you are posting about! Many thanks