Of particular interest to those who trade with signals provided by RSI(2) is the tendency of the measure to portend a reversion to the mean. When RSI(2) crosses an upper threshold, it is often a signal to close longs or to sell short. Similarly, when it crosses a lower threshold, it is often a reliable signal to cover shorts and initiate longs.
What makes trading RSI(2) exciting is that when markets begin trending, rather than reverting to the mean, RSI(2) will often stay elevated, or depressed, for extended periods of time. When it stays elevated, it appears to me that it just floats for days at a time, not really moving up or down. Unfortunately, a floating RSI(2) can be painful when one was expecting a quick move in the opposite direction. I know the last 3 days have been painful for me, as I’ve been net short the S&P 500.
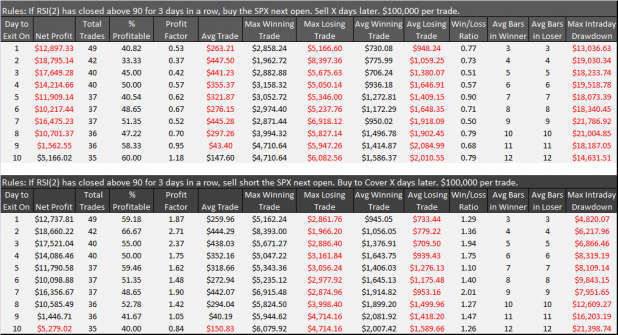
I decided to take a look at any edge this setup might provide. What I tested was going long or short the SPX after RSI(2) closed above 90 for 3 days in a row. The test then closed the trade out X days later.
 I was rather embarrassed after I completed the study to realize that today the SPX just missed having its RSI(2) close above 90 for a third day in a row. RSI(2) closed at 88.07 It is probably close enough to still make the study applicable to the next few days of trading.
Results are below and cover 10 years of data for the S&P 500.
The top sheet shows the results for going long the SPX after the setup, and the bottom sheet shows the results of shorting after the setup.
It appears that the Bears have the edge over the next 8 days, with the next 3 days showing a good likelihood of a pullback.
There are a few other metrics that should be of interest. I particularly find the difference between the drawdowns to be significant. Also, the profit factor for the shorts is roughly 4x that of the long side.
Caveats:
After 10 days, the longs start working much better and show good net profits which peak near the 25th day.
Had I looked back another 30 years or so, the long trade would have out-performed the short side, even over a shorter time frame. RSI(2) did not always work well as a mean-reversion measure.
__________________________________________________________________________________________________
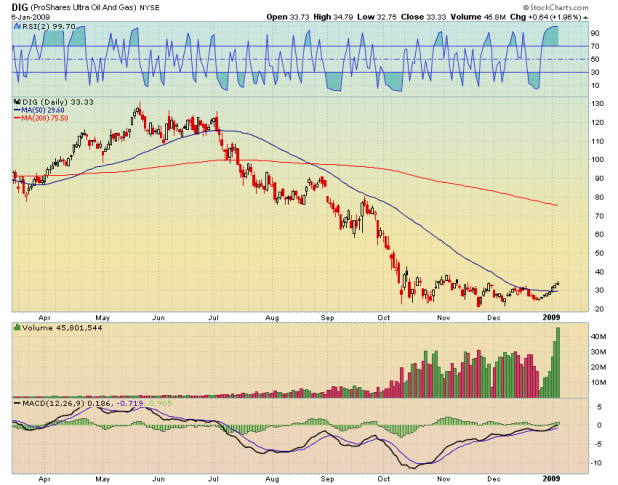
I included the chart of DIG as it shows an excellent example of a floating RSI(2).


Great study Wood. The volume build-up on DIG is impressive though, I wonder what this study would look like of you added a volume component.
very nice Woody.
You should be embarrassed, rightfully so.
Fly, what’s a few points, between friends?
Actually, I had coughed and spit some brown gravy on my screen. It made the reading look like 99 instead of 88.
Had I went (sic) back another 30 years or so…
Oy!
________
Next time keep the bodily fluids to yourself. Just touch the screen. I am sure some of the BBQ sauce can do the job.
Wood’s tab bangs like a gong, everybody gots to hear it.
I think of oscillators as flatteners of some variable or another, which makes them weak at extremes, ironic since that is usually where they trigger action. I like the system stuff filtered by discretion – to watch market movement and see what the players are doing and then have an 80% shot for this or that play. It’d be great to have a compendium of systems making summary odds together, some % long or short at all times lol. Discretion has a place, filtered numbers just fit the data, while the traders sees the current state, what with bears making room for a future where they have banks to keep their money, har!
They gots to come growling when Obama uses his pen tho..
Aumana, Rob at quantifiable edges blog and Michael at MarketSci blog are both using a “compendium” of sorts, making summary odds together. Everything is aggregated to determine where the edge is and over what time frame it exists. Check my blog roll for their blogs.
So the results shown here are over 10 years? Although the profit factor looks good standalone this means that this system returned 18k on 100k over 10 years? That doesn’t seem too great. I understand that the system would spent very little time in the market which is great, just wondering.
Any thought as to testing the opposite RSI(2)<10% 3 days?
Also, what happened w/ Disqus? It is nice not to have to revisit an old posting to keep up w/ a conversation. Isn’t there a plug-in that lets emails you with followup to your comments?
B-rad, don’t think of it as a system. Instead, think of it as a market timing instrument. I was more or less just trying to determine what happens when RSI2 stays elevated for extended periods.
I will test the opposite as well, but keep in mind its not RSI2<10%. Rather it is RSI2 closing beneath 10 for 3 days in a row.
Re: Disqus. Fly is an old man and hasn’t yet begun to understand new-fangled technology. I don’t know what happened to the plug-in. I’ll check though.
Yeah, i was going to say “market timing instrument” but it’s too early in the a.m. 🙂 Point being 18% doesn’t seem great, but i understand the simplicity of what you are going for.
I assume that you are entering next morning after SPX closes above RSI(2)<90 for the 3rd day and exiting after 2 days to get a total of 4 bars, is this correct:
Enter @ open, 1 day, 2 day, exit @ open?
B-rad, RSI@ > 90. Not less than, but I’m sure it was a typo. Yes, enter on morning after it closes above 90 for 3 days straight.
As for the exit, the sheet just shows the differences between exiting on day 1 (which is really impossible as I set it up to exit on the open) through day 10. You’ll notice that it loses its edge as it gets closer to day 10. I assume this is because while elevated RSI2 readings are bearish in the very near term, they seem to be bullish looking out over longer periods (weeks, not days).
Thanks, I was just making sure I understood how the trade averaged 4 bars when it “exited on day 2.”
B-rad, let me see if I can explain it. And actually, I might have it wrong. I’ll to look at the code to be sure.
The first bar is the entry bar, and doesn’t count as bar 1. The second day should be bar 1. The third bar would be bar 2, and the 4th bar would be day 3.
I think that is correct.
Today is shaping up to be a 2.5%+ day for me. Every single trade is documented.
Edited from 5%+. My math was a little exuberant.
Excellent work.
Thats exactly how my code works as well, re bar zero, bar 1 etc.
props on the shorts sheddrick, me = +4%
Nice.
I missed this post but was thinking along similar lines with the Qsinator (say change the buy signal to 2+ days of the high being below the 5MA or something) but haven’t had time to work that out.
I have to dig through the archives because someone posted this little known system that had something to do with 4 day windows and market timing.
I have been meaning to ask this – I use the ChiSquare to validate a method and if it’s not statistically significant then I file it.
You seem to look at profitability with backtesting.
I suspect they’re mutually exclusive otherwise the edge would fade pretty fast.
Thoughts?