Gio has had much success using the VIX as an indicator of market sentiment. He will often mention when the VIX spikes and dips and will use those spikes and dips to know when to switch from a long bias to a short bias, and vice-versa.
I thought it might be interesting to test a basic system for using the VIX to suggest when to go long or go short. Doing so will allow us to propose a rough quantification of what constitutes a tradeable dip or spike.
I’m sure that there are others in the blogosphere that have studied the VIX as a timing mechanism. When I have more time, I’ll link to the studies assuming I can find them. Feel free to post links in the comments section.
Below are the results of the study.

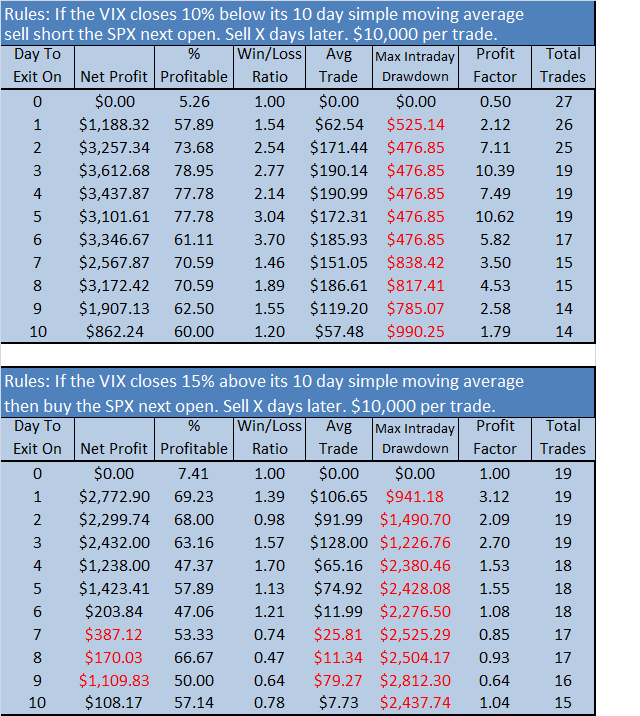
The first report show the results of selling short the SPX after the VIX has closed more than 10% beneath its 10 day moving average. ***I just realized the rules for the short entry should state “buy to cover X days later” and not “sell X days later.”
The second report shows the results of going long the SPX after the VIX has close more than 15% above its 10 day moving average.
What is immediately obvious is that the VIX has been working well as an indicator of overbought conditions. The setup has generated short sell trades of which 75% were profitable looking out over 6 days after the entry. The max intraday drawdown is about 2.5x the average trade. The win/loss ratio shows the winning trades are 2.5 to 3x larger than the losing trades.
On the long side, the edge is diminished very quickly. By the 4th day after entry, the percentage of profitable trades drops to 47%. Negative expectancy is produced by holding until the 7th day after entry. The win/loss ratio is not nearly as generous as it is on the short side, and the max intraday drawdown is averaging more than 20x larger than some of the average trades. In other words, the risk may not be worth the reward. Adding a stop loss and some additional code to keep out of longs during a cascading market would probably improve these metrics.
Conclusions: As Gio has highlighted many times, using the spikes and dips in the VIX can create a tradeable edge. This edge can produce 3x more winning than losing trades. This edge is currently much stronger when using the VIX to indicate an overbought market.
Caveats:
This study is looking at only 2 years worth of data. I chose a short time frame because this system did not really do much of anything until the volatility ramped up in 2007.
During all of 2008 and part of 2007 the SPX was in a downtrend. That may explain why the short setup has out-performed the long setup.
I did not add commissions or slippage into the calculations. This is more a proof of concept.
For the Visually Stimulated:

The screen shot above shows the VIX in the bottom pane and the SPX in the upper pane. The blue line is the 10 day moving average. Notice that a buy signal was issued Wednesday for this (Thursday) morning.
Finally, for all things VIX, visit the ultimate VIX blog, Bill Luby’s VIX and More.


Thanks for another helpful post. I have been
watching the VIX and using it to better trade
since learning more from posters like you. Your
time is greatly appreciated I know from everyone.
Thanks mst333. I’m glad you found it helpful. Also, its nice to see new readers dropping by.
Wood
Of all the pictures presented on IBC — there is simply none better than that ape-drape white trash guy standing by his pick-up truck — makes me chuckle every time.
Thanks for your work here.
I agree working man. That pic is hilarious!
Is that a tradestation chart?
Jason, it is a tradestation chart.
i like this. i own FAS. do you like FAS?
Hey wood, thanks for this. really good stuff! I think only recently has this method worked due to all the volatility. I got more conservative by using “double spikes”, on the reasoning that the first spike is “initial fear”, and the second spike is “short term capitulation”… capitulation (for bulls or bears) is usually a good sign that a trend is about to reverse. I’m sure if there were some way to back-test that you’re probabilities will significantly increase. I guess from a statistician’s point of view, we want to trade the outliers.
another thing that will increase your probability for winning is to increase the time for the trade. Using the “spike theory”: For example, when I said “get long at Vix 60.xx” on November-December, the Dow melted up almost 1,000 points. Then when I said “get short at Vix 35-38” the Dow dropped over 1,000 points. So far, I think your post and analysis have been the best explanation I found yet. Honestly, I have a hard time putting in words how it works, its become more of a feeling after doing it for about 1-year now (only recently have I applied it to day-trading).
Thanks again Wood! and hope the Bamboo will soon spit out a trade.
-gio
BOTD, I’m waiting for the triple leveraged ETFs to get some more data before I begin testing strategies on them.
Good update. Here is a longer-term look at that from last summer back through 1998:
http://marketrewind.blogspot.com/2008/07/quick-vix-stretch-study.html
Naturally, there are better ways to exit other than to wait for N days. For those that are interested, I post the current stretch against the 15-day every weekend at: http://marketrewind.blogspot.com/search?q=weekly+rewind+week (bottom right).
Best, Jeff
Thanks Jeff! I knew some others had blogged about it.
Wood, Is there a list of other sites/blogs that you recommend that talk about trading systems?
Sia, a lot of the sites on my blogroll are systems traders. That would be a good place to start.
Are you the same Sia I’ve seen posting code in the Tradestation forums?
Thx Wood (plus Gio comment). Interesting that Fly and Danny took short positions at the close today, with the VIX low.
Wood,
You might try normalising the VIX data so you can look at longer term trading signals.
I think log(2) is a good way to start.
Jeff: I took a look at your site. Any comments how your VIX charting has helped your trading?
Great post. Thanks.
Hey Bob B. – I left my links at Wood’s request and don’t want to hijack his blog lest I get taken out to the shed! I’ll answer over at “your place.”
That photo is not “hilarious”, it’s cute, a very cute hillbilly. Please show some respect. 🙂
Jeff, in all seriousness, I love when folks hijack threads. Generally, I just love the discussion. Just an FYI in case you get the opportunity in the future. However, do visit Bob’s blog as it is worthwhile..
Of course what is even better is being associated with cute hillbillies, but I’ll reserve that role for Boca.
oops sorry, didn’t mean to change the topic of your thread, just got all fired up for some reason over my fave photo.
FYI I printed your post above for future reference, nice work.
Try filtering with a trend. Remember last year when everyone was saying the VIX had topped at 40 because it reached it was so far over some moving average?
Good info but using an index is not the same as using SPY or ES. I’d love to see some results using SPY or ES.