Lazy Man began leaving comments on a recent post, Short Term Mean Reversion Still Working.
He asked for some help improving exits on a system he uses to trade futures. The comments section of the post will show how the idea for the project developed.
Because I’ve never worked on an intra-day system for futures using tick charts, I decided to see what I could come up with. It seemed as if it might be a good opportunity to help someone else out while providing me a chance to practice coding and backtesting.
Lazy Man’s System
For ES, a 3200 tick chart is used.
9:30am to 2:30pm entries only.
Trades are entered at the close of the first bar that trades completely above (long) or completely below (short) the 20 period EMA.
The high and low must not touch the moving average. The previous bar must have at some point traded beneath the 20 period EMA. (The entry is a variation of the classic moving average cross).
Trades are closed when any of the following are true:
1. 3pm
2. Any bar extends to the wrong side of the MA by 50% or more.
3. He feels like the trend is over – and there is the problem – too much emotion. Lazy says he often exits too early or too late.
Let the Testing Begin
A baseline must first be established.
1 contract will be traded. $2.50 per trade commissions are included. The period tested was from 10/08/2008 to 4/09/2009.
I chose to start testing the longs first, coupling the entry with a simple time exit.
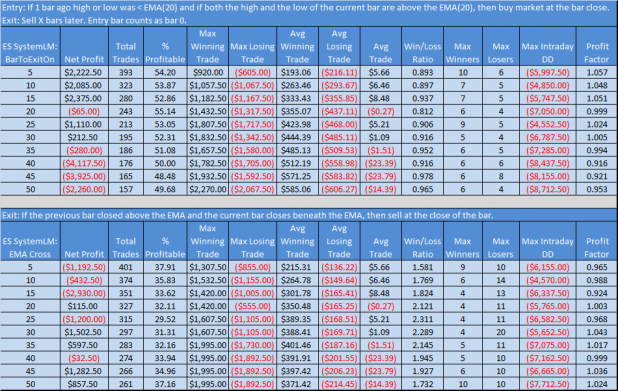
The results are in the top half of the spreadsheet below.
With the time exit results established, I then tested an exponential moving-average cross. The EMA cross exit triggers when price crosses and closes beneath an EMA. The results are in the bottom half of the spreadsheet.
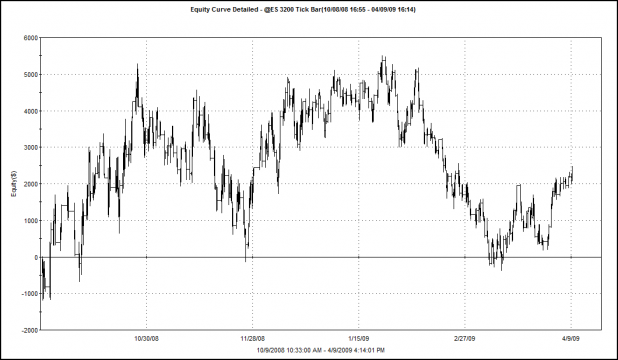
Below is the equity curve that resulted from the baseline results, optimized to exit on the 15th bar.
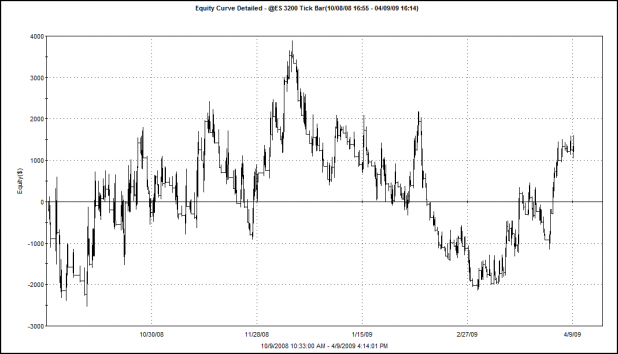
Below is the equity curve for the moving average exit, with the EMA used for the exit optimized to 30.
So far, neither exit looks very promising.
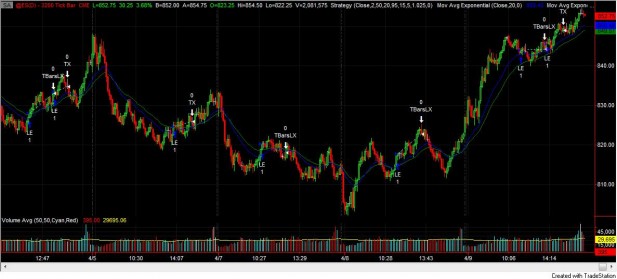
Recent Trades are Below:
TBarsLX = 15 bar exit; LE = Long Entry; TX = 3:00 o’clock exit
What’s Next?
I am going to keep testing exit signals until either I get bored with them, or I can no longer code them due to their complexity.
Lazy’s stops must also be tested.
Eventually, a smooth(er) equity curve may be produced.


Wood,
I’m sending you a chart from Wednesday to post if you think it may help. This will give a visual as to the entry signals along with a pretty good idea as to the drawdowns that should be expected before the trades becomes profitable (usually very minimal compared with other entry signals I’ve seen).
It is important to keep in mind that this system generates ENTRIES ONLY and has a stop in place based on price action and the MA. It does not generate profit targets. There is typically ample opportunity to take profit during the trade but, until this exercise, this has been left to trader discretion.
There were 3 entries that day:
#1 – short 813.75, best exit would have been +2.75, worst exit (stop due to cross back over MA) would have been -1.25. There would have been a 0 point drawdown before the best exit
#2 – long 816.5, best exit would have been +8.75, worst exit (stop due to cross back over MA) would have been – .25. There would have been a -.25 point drawdown before the best exit.
3# – short 816.5, best exit would have been +2.5, worst exit (stop due to cross back over MA) would have been -2.25. There would have been a -1 point drawdown before the best exit.
Total for the day at best exits +14, at worst exits -3.75. Total drawdowns experienced before best exits – 1.25 points.
This chart is a pretty fair representation of what this system calls. Some trades give a couple points and reverse (#1), some trades are great (#2), some trades chop around a bit but would have given the opportunity to get out with a profit at some point before being stopped out (#3).
Keep in mind that trade #3 was into FOMC minutes, into 820 S&P support, and into a trendline acting as support – you would have to expect some chop here (and perhaps ignore the signal).
So, the quandary is this – some trades are exceptional, some trades are best exited for a quick profit, some trades will chop around and need to be managed a bit (or ignored).
As a whole, the drawdowns are low, stops are usually not too painful and there is opportunity on most every trade to get out with a couple of points (or take the risk to see if it becomes a trade like #2 where it runs for a while).
That said, when it comes to profit targets, time stops probably won’t be the best answer – but it was interesting to see the results.
My thoughts would be:
1. Some sort of PT that used ADR (15% of ADR for example).
2. Some sort of PT based on average drawdowns experienced. For example, if your average drawdown was -1 point and the system produced 50% win, set a 1.75 point PT (as long as a high enough percentage hit +1.75). Odd idea and these are not the right numbers I’m sure but who knows?
3. Continue to use indicators (Bollinger Bands, MACD, Stochastics and trader discretion).
4. Ask other traders for ideas…
This might help others to see where I am coming from/what I am trying to accomplish:
First, be clear, this system should be of no interest to traders, the likes of Fly, who can rotate in and out of positions like FAS & FAZ with grace and aplomb. This system should only be of interest to those who are gift-boxing their money and express mailing it to traders like Fly on a daily basis (the other 95%). It is, admittedly, boring(ly profitable).
These are somewhat abstract thoughts but I believe the answer to this may be a bit abstract in itself. This system has some key strengths and some weaknesses that need to be managed:
Strengths:
1. Calls out entries for EVERY trend (by default, there can be NO trend if the action that causes this entry signal does not happen). Is this true of most other indicators?
2. Read #1 again – this is the core strength.
3. Minimal potential drawdowns and/or stop losses compared to respectable potential profit.
4. No “guess” at the entry – a clear signal with a 100% exact time/price/direction entry.
5. Does not require the trader to understand, absorb, or otherwise guess at where news & events will move the market. The signal is the signal. Potential to work well for the “other 95%.â€
6. Enough entries to keep many daytraders mildly amused unless you have ADD and want to burn through your account.
7. I’ve live traded this system for 7+ months and I know it is consistently profitable with low stress (I sim traded it for 30+ days prior to that).
Weaknesses:
1. Not every signal will result in a solid trend but, can any indicator do that?
2. If traded on some markets, there are may be 2 or 3 small to moderate drawdowns before a nice trend is caught (6E, for example, on Thursday had a 31 pip drawdown with 2 trades before it produced a 135 pip profit on the 3rd trade). Net +104 pips.
3. No clear obvious exits. Only stop losses based on price action. Trader discretion to exit based on strength of the trend.
4. Boring for most traders.
5. Trader must identify a market that is conducive to this system (currently ES, ZB, 6E), must watch to be sure the market state is not changing, and must react accordingly.
With all of that said, the KEY question becomes:
“If a system can call EVERY trend with some trends ending quickly and some running for hours, what is the best way to determine weakness in the trend without exiting prematurely. If no reliable indictor or scheme (scale out, % of ADR, etc.) can be produced, what then, is the best way to manage simple profit and loss targets to mitigate risk and maximize profit based on the entries called by the system?”
Lazy,
i’ve been messing around with you system a little bit and it definitely gives plenty of opportunities for large runs…if you sell at the right time.
what if you set a price target of, say, 2pts for the first contract then move your stop to the entry point and let the second contract run? sell when it either stops out (at the entry) or when the candle closes 50% past the MA in the wrong direction. then you would at least have a small gain most times and have the chance to catch a large run.
thoughts?
j.M
j.M.
It does entice with, “look at what I could catch with this system” when you view it on a chart.
I do extract profit from it but it does get sticky sometimes.
Yes, I have had many thoughts about various strategies to scale out and I usually do (I typically trade 2-6 contracts depending on the market – 2-3 with bond and currency futures, 2-6 with e-mini s&p).
I think with your idea the first contract essentially locks in some profit and/or offsets any loss that
may have incured during a previous trade where the rest of the contracts become your profit.
One odd idea I had was to lock enough to cover any previous drawdowns during the scale-out. For example:
Trade 1 – lost 1 point overall
Trade 2 – lost 2 points overall
Trade 3 – scale out by selling 3 contracts at +1 to cover loss from 2 previous trades, scale out of #4 at +2 for a small gain, let the rest run.
A kind of sick twist on a Martingale system if you will.
I’m getting a little exotic with this though and I think it may prove way too dificult to backtest with any bit of reliability.
Shed,
You were testing long signals only in a nasty bear market, and got a positive equity curve with a worst case 48% win rate with only a crappy time exit?
This looks like it deserves more testing.
How did shorts do?
What was the average loss before full profit?
What was the average full profit?
How about profit targets based on that and going back several weeks/months (adjusting as the market adjusts).
Lazy,
it’s like with any system – you have to do what fits your personality. i’m pretty happy if i can consistently get 2 points a few times/week with the occasional runner. i found that with a 2.5 – 3pt stop loss and a 2 – 2.5 initial target this system works pretty well.
what, in your opinion, is the best market to trade after hours? i would use a 5min chart rather than a tick after 4pm but am looking for the most liquid market that an east coast trader can trade after ‘day job’ hours.
j.M
Starr, I will attempt to address all those issues.
Keep in mind it takes some time to produce the spreadsheets and the blog post itself, so I will roll it out in pieces as I have time.
Hopefully we’ll be able to pick and choose some of the best components: profit targets, exits, stops, etc. to come up with something that Lazy can feel more confident about.
Starr,
I agree. I traded it long and short during that actual timeframe and I had much smoother results. I’m happily up quite a bit of money as a result.
Not a bad idea for calculating profit targets – something to explore. I’m not sure you can really do much to cut back on drawdowns – the system already has a fairly low stop loss that works pretty well (the 50% cross-back). The key is to extract as much profit as possible.
j.M.,
Personality is everything – I think a lot of random people posting on these boards are taking obscene risk without the required insight and talent (not talking about the tabbed bloggers or some of the many who actually do appear to “get it”). Talking about the 95% who do not make money and should be following a structured system – but it’s just not very cool…
If you are looking for a couple of points per day with moderate risk and reasonably low drawdowns, this system should fit your personality well. I would caution though that, while the entries are good, you have to be either good or lucky enough to get out at the right time (or at least not the wrong time).
As for after-hours, I will sometimes trade ES (I stay away from the less liquid markets – the moves are often too violent).
Not sure if you prefer scalps, swings, etc. but this system can be modified a couple of ways for after-hours:
1. Use the system and extend the hours slightly – start at 7:30 or 8am maybe? I have not tested for that and I’m not a morning person so I will not be testing for that in the future!
2. Use the existing tick value to take long or short signals after 3pm and hold to PT or overnight. The system has had some amazing swing calls based on the existing settings but I do not trade it that way – I like to sleep and the overnights are not always rational.
3. Change the tick values to match the lower volume. Example, if you see 500 contracts/minute on a 1 minute chart, try the 133 tick setting and see how it picks up trends. I DO NOT TRADE THIS so you will have to watch/backtest first to get a feel for it.
4. Change to another system. When I trade overnight, I change my time & sales to show trades of 10 or more contracts. It is very easy to see repeated heavy hits to the ask or the bid – this is either someone trying to drive the market in one direction or (usually) arbitrage programs which also keep the after-hours markets in sync with each other (have you ever wondered how the YM & ES move in exact tandem – almost to the second). After a while, you will get good at spotting potential trends this way. This is especially useful to get you out of the wrong side of the trade before it moves too much.
Here is an excellent article which gives some perspective on that: http://zerohedge.blogspot.com/2009/04/incredibly-shrinking-market-liquidity.html
Wood,
Yes, lots of time… I’m actually a bit surprised too that it did as well as it did with just time stops and longs only during a 300 point drop in the S&P. The equity curve even looks oddly correlated yet still ends positive in a downtrend?
Forgot something important. The data includes 2.50/trade for commissions.
Even better…