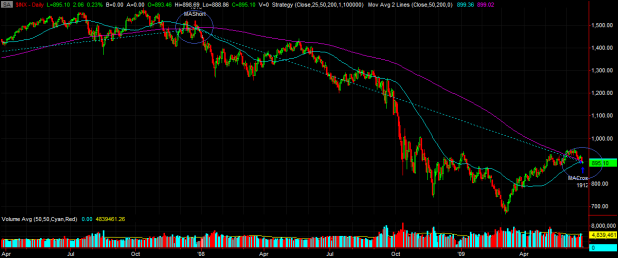
The Golden Cross is complete as of Tuesday’s close. My Tradestation platform is showing the 50 day simple moving average to be 899.36 while the 200 dsma is 899.02.
Now that the huge short trade (entered on 12/21/07) is closed, I want to examine the statistics on both the long and short side trades (the short signal being a cross of the 50 day average beneath the 200 day average, or The Death Cross).
This was one heck of a trendfollowing trade!
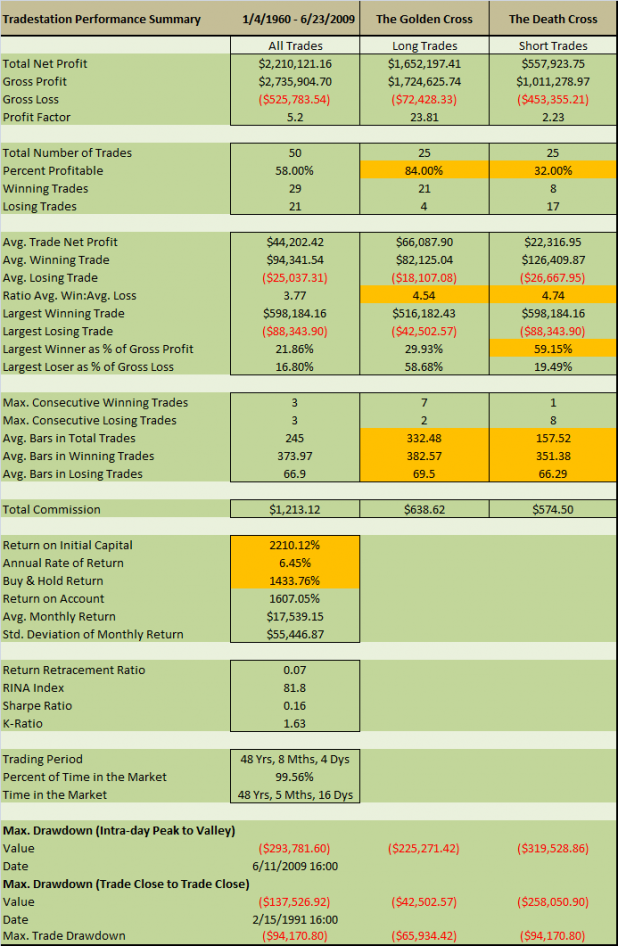
Statistics:
Note that this test buys and sells, shorts and covers on the close of the day of the crosses. The previous tests traded the open the morning following the crosses. Commissions of .008/share was used. No slippage was added. Gains were compounded.
I’ve highlighted the metrics that I think are most important.
First off, the win percentage of 84% for the Golden Cross is impressive.
Moving down the sheet, the ratio of the average win to the average loss is very good for both the longs and shorts. This ratio shows that the winning trades are on average over 4x larger than the losing trades.
Also note that one Death Cross trade was responsible for almost 60% of the gross profit. This huge winner just closed today.
The section of the report that shows the average bars (days) in the trades is very interesting. We can use the statistics to make some forecasts. If this Golden Cross is going to be a loser, on average, another Death Cross will take place in 70 days (3 months). If this Golden Cross turns out to be a winning trade, it means that it will be, on average, almost 2 years before we see another Death Cross.
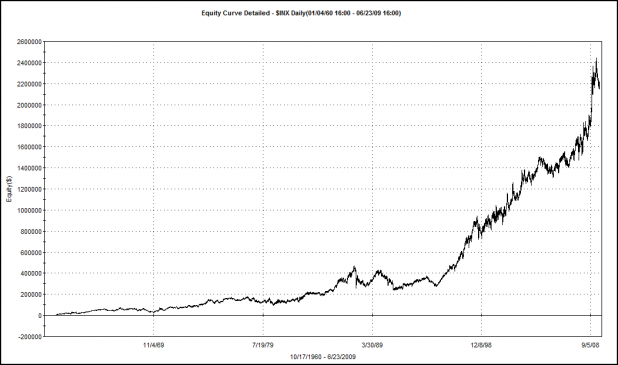
Finally, we see the metrics that show how this system performs on an annualized basis. We have to compare the Return on Initial Capital to the Buy and Hold return to see that trading the Golden and Death Crosses beats Buy and Hold, but has yielded only 6.45% annualized.
More Charts:
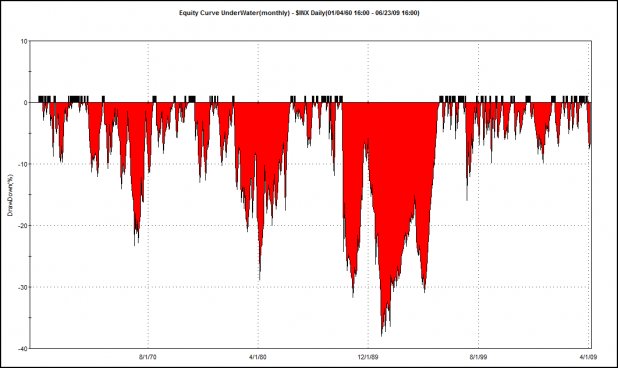
Monthly Underwater Equity Curve (Drawdown)
The system hasn’t had a monthly drawdown greater than 10% in over 10 years. These drawdowns improve a great deal when the system is long only. A series of losing Death Crosses whipsawing the system is likely responsible for the worst of the drawdowns.
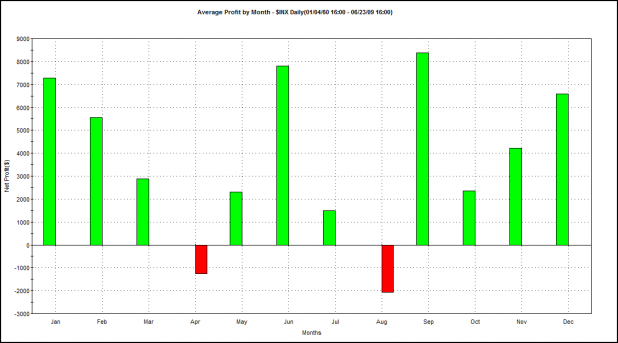
Average Profit by Month
The system is approaching two of the worst months, in terms of monthly performance. Isolating the Golden Cross metrics shows that July and August are the ONLY months that lose, on average.
Equity Curve: Trading both the Golden and Death Crosses
Summary:
For the investor/trader with a long time horizon and a buy-and-hold mentality, this setup is tasty.
Using the Golden Cross for forecasting, even with the technicals degrading over the last couple of weeks, it looks as if there may be a chance for the rally to continue sometime over the next several months.



(the short signal being a cross of the 50 day average beneath the 200 day average)
Which is known as the “Dead Cross”.
This I am interested in.
I had always called it the Death Cross, myself, but either gets the point across!
Updated post with a chart of the entire short trade from 2007 to today.
Has there ever been a time where the SPX was trading below both MAs when the cross occurred?
I like to refer the failure (cross below) as the Kiss Of Death myself. That said, i believe the study will show that this is a good signal to play. The odds of a successful trade are very good and your risk is managed well by the fact that your stop will be a cross below the 200MA.
Bhh, no, there has never been a time. This is the 26th cross since 1/1961 and it has never crossed with price beneath both MAs.
However, there have been a few where price dove beneath both MAs shortly after the cross.
some ML technical for ya if you like reading it..
Mertechnicalyest
308, thanks. For anyone else, it is a decent report and worth reading.
How do you trade the SPX? Do you use the SPY to trade this? Won’t the crosses be different in that case?
Ash, Tradestation and AmiBroker (2 different data sources) have the SPY crossing over today as well.
Typically I will only run studies on the tradeable instrument, for several reasons (of which I won’t go into right now).
However, I chose the SPX rather than the SPY because I had 50 years of data for the SPX and only 15 on the SPY.
Secondly, one way the tradeable instruments differ from their underlying is that they gap. Since this affects the open, not the close, a moving average of the closes should be very close on both the ETF and the index.
Wow, this party is great. Where’s the goji juice?
I was hoping Chuck would bring some Drank.
What the hell is goji juice?
you call yourself a nerd?
http://www.gojijuices.net/gojijuicestory.html
Fly, this site looks more like you.
http://gojijuiceinfo.org/
Drinkin’ that stuff down South will definitely send a message.
Wow, Shed… 80% win ratio with a 4:1 profit/ loss. How far back have you tested this thing of beauty?
Shed… you’ve only run this for a few months. Get real.
Wood,
Good stuff. Good to see a system trading for the longer term. And good basic moving average system, no craziness and overfitting, etc. I have been playing around alot with MA and EMA systems along with ARIMA models on the MA and EMA’s. I like the direction these are going.
j, 50 years of data. Its very simple and well-known, yet it still has an edge.
Caveman, here is my FAVORITE long term trading system. If you haven’t seen this research before, I have a feeling you will really enjoy it:
http://papers.ssrn.com/sol3/papers.cfm?abstract_id=962461
The system in the article above is similar to a moving average cross. It requires the monthly close to close above the 10 month moving average on 5 different asset classes traded through ETFs.
Here are the charts showing the monthly bars and 10 month moving average.
http://stockcharts.com/def/servlet/Favorites.CServlet?obj=ID3390852
I should note that while there is 50 years of data, the sample size is unfortunately on the small side with only 25 trades each on each side (long, short).
Cave man, Shed…
You guy have heard of Renaissance capital, right? Julian Simon(?) and old math professor runs it. The guy has been getting staggering returns over the years essentially using a quant model.
He got so rich he’s now basically running his own money.
Do you guys know what sort of system he runs, broadly speaking.
Wood, freaky deja vu! Just now as you posted that, I was off trying to find the link to that same article to see if you had read it! It is an excellent article and really is a very solid piece of proof for general market timing and against buy and hold and market efficiency theory.
Just thinking out loud and looking at your system stats, it strikes me that the long and short trades should have different criteria because tops and bottoms are fundamentally different with tops being typically rounded and bottoms typically being spike v-shaped. That would explain why the long trades are so much more successful.
I just swapped to bearish on the market last week but my bias is a shorter term bias than this system so we can both be right here, just on different time frames.
Thanks, Woody. Great work, as usual.
The Southern hospitality, a bonus.
Good evening, Sir.
RenTech runs very short term high frequency scalp algorithms, I believe.
ZeroHedge recently published Simon’s letter about a new system, if you are curious about what he’s doing, that might be a good place to start.
ZeroHedge also published something saying that RenTech has the worlds 6th fastest super computer.
Caveman, there are often times when a normal market correction will cause a death cross. Usually, in those types of corrections, the death cross often happens near the low of the correction. In other words, the death cross was a buy signal. I would guess though that every 10-20 years will have a very very profitable short trade that will make up for all the whipsaws.
Also, you are right, tops take some time to develop, and are often slow and grinding, while bottoms are usually quick and powerful.
Wood,
That is great research and analysis. Don’t worry about the Gojijuice, just some fine ‘still lightnin’ ‘ul do. Man I look at the stuff you guys do here, fuck I’m such a piker.
Where do you find the time?
Out fucking standing. Oh and Kaiser the dog is way impressed.
Mustard, thanks!
As for time, I’m on vacation right now…so I have more than usual. Trying to knock out a lot of testing over the next week or so.
I just hope its warm and sunny for you. Do try to get some rest. It seems everyone of the staple bloggers here has been on fire and its so cool that everyone has a different way about it. Again, that is great stuff.
Wood,
Great post!!! Even after two scotch on the rocks, I think I get it. But tomorrow, I study it!
More than two scotch on the rocks over here (end of school year celebration) so I don’t know what the fuck this shit is at all. Robbie Knievel is here though, right? I saw him do that death cross thing before – Vegas I think.
Awesome!!
I hate fucking draw downs!!!!!
I dont like being a bearshitter DD fucktard…but have we had a golden cross with 10% unemployment and 60% factory utilzation not to mention a 10 month housing supply plus debt out the ass………
Wood, Put that shit on a weekly and let me know how good it looks.
Nice post though 😛
Nice work.
Great graphs.
It’s reassuring to see a mechanical system this old still holds it’s own.
Does all this moise mean?
Do I buy the spx off this or sell it short
Keep it simple stupid
Wood, Good stuff. Thanks. It’s always nice to see something for the long term traders.
Hey, what’s going on here… http://img200.imageshack.us/img200/5444/holycross.jpg
Sorry I missed your party, Shed. I went to bed early.
Fortunately, I’m already long from March. This is more confirmation to hold.
Fly has expensive taste in juice!
http://www.cbc.ca/marketplace/2007/01/goji.html
The most interesting thing I see, is the worst performance comes in August, which would fit into a pattern failure based upon earning surprise’s coming out of the mid-year reporting period in July. This would work both way’s, as the Golden Cross would fail when earning’s fail to meet the bullish expectations that caused the run up into the Golden Cross, or in the case of the Death Cross, we get an earnings “surprise”, where upbeat earning’s destroy the bearish case. I imagine it would probably be impossible to go back and see if that was the case, but the time frame seem’s to be a decent fit for the senario.
i hate to be stupid, but i am so there’s no sense in flopping around on my own. Shed, in summary buy the market on a Golden Cross and sell the market on a Death Cross? thanks for all your work!
Cucca, good to see you over here on my blog!
I think that the weak August performance may just be seasonal summer weakness, but I hadn’t considered earnings cycles, which also makes a lot of sense.
I have not looked specifically, but I would bet that there were several summer whipsaws where one entered the death cross short on summer weakness only to see the markets roar away from the correction in September.
Franky, I would not necessarily use the short signal (Death Cross). However, you are correct in that there is an edge for the long term investor in buying the Golden Cross.
Thanks!
I see that there is no optimization attempts on this system. Why did you choose the parameter set you did (50/200)? And are you sure this is the most robust parameter set going forward?
The problem with only backtesting without optimization or walk forwards is that you really don’t have a good handle on how robust the system really is.
You only have past performance.
And you know what they say about past performance.
Milk, where you been man? The 50/200 day averages are about as standard as anything can be in ever-changing universe of stock-trading and investing. There are books going back decades that reference these two averages.
The point is, even with the popularity of these averages, there is still an edge.
In fact, you could consider pretty much the last 20+ years or so as out-of-sample results, since these particular averages have been used and tested so extensively.
And I take issue with the statement that backtesting without optimization doesn’t tell you how robust a system is. Yes, optimization should be used to give you an idea of how large/wide/broad your edge is, but most people over-optimize to the point of curve fitting. The fact is, these averages have worked for at least 50 years, and based on other research I’ve read, they’ve probably worked for 90+ years.
Finally, how would you optimize this? Would you use between a 20-70 day short avg. and a 100-300 long average?
What if it optimizes at 20, 100? You really do not have the same system as that would be a short to intermediate term system.
In fact, I ran a quick optimization, allowing the short avg. to test from 20-80 and the long average to test from 200-50. The optimization came out at 10/110 and does 1/4 of the net profit of the 50/200 cross.
The point is, this setup is so well known and has been for so many years, that the fact that it holds up, beats buy-and-hold, improves the drawdowns, etc., means that it is robust.
We could certainly optimize it, but then it would probably become a different kind of system.
My bad Milk. Turns out I had 2 strategies running instead of just the golden cross. I re-ran the optimization and it came out to 60/190.
That combination improves the annualized return by 0.30% but increases the drawdowns.
If nothing else, it leaves 50/200 looking robust.
The 50/200 cross has been around so long that I’ve even heard of it before. And to an extent, it is a self-fulfilling prophecy as fund managers are compelled to sell and buy based on the 200 MA.
As far as the problem of curve-fitting and its association with optimization, I would only agree that improperly executed optimization yields curve fitting. If you ‘tweek’ your system for no good reason but that you’re able to ‘catch’ a huge trade, that’s curve fitting.
When I get a chance, I’ll run the backtest of the cross and then paint an optimization space.
What is your criteria for the best parameter set? Net profit? Net Profit/DD? Pessimistic Return on Margin (I like this one)? Percent profitable?
I’m also disturbed (shall we say) with the statistical problems associated from drawing inference from a small sample size.
You’ve also only tested on one market. How about we throw a few more in there to make sure we aren’t just witnessing a monkey type out Hamlet.
Let me make sure I got the pseudo code correct. We buy when the 50 is greater than the 200 and yesterday the 50 was less than or equal to the 200, and we buy on the open of the next day. The same for the short side.
Is that right?
Okay, I ran the backtest on ES futures for 25 year lookback. I’m using the continuous contract. The average annual return on the 50/200 cross is about 10%.
I then ran an optimization with the fast average ranging from 30 to 100 and the slow average moving from 120 to 250. It yielded 112 permutations.
You can view the optimization space based on Net Profit and Pessimistic Return on Margin.
http://is.gd/1cENv
Milk, left you a comment on your blog.