iBankCoin
Home / Double 7s

Double 7s

Deconstructing the Double 7s: 3D Optimizations

If you need an introduction to the Double 7s series, go here.

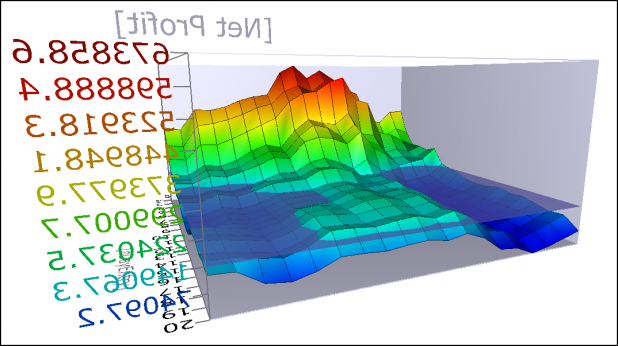
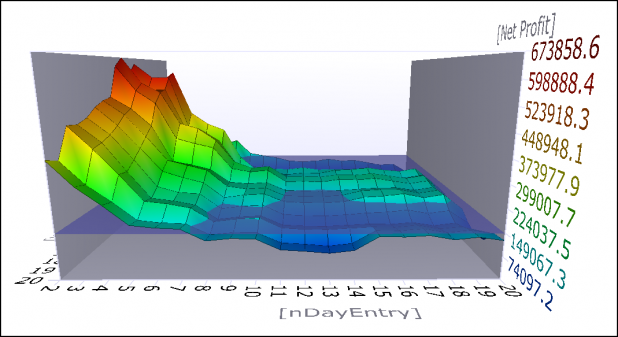
The graphs are the result of running an optimization report in AmiBroker. Testing in Tradestation yielded an optimum setting of 2 and 11 days, rather than the 7 and 7 as publicized by TradingMarkets. The AmiBroker report confirms the Tradestation results.

Some explanations are in order. The nDayEntry represents entering on the lowest close of n days for longs and exiting on the lowest close of n days for shorts. So while it says entry, it is only the entry for the longs. It is the exit for the shorts. Note that the entry edge falls off fairly quickly, as does the exit edge for the shorts. The textbook 7 day entry looks like nothing special and only returns 1/3 of the optimized entry and exit.

The blue underwater mark is set around 150K, but since this system did not lose money, technically nothing is underwater.

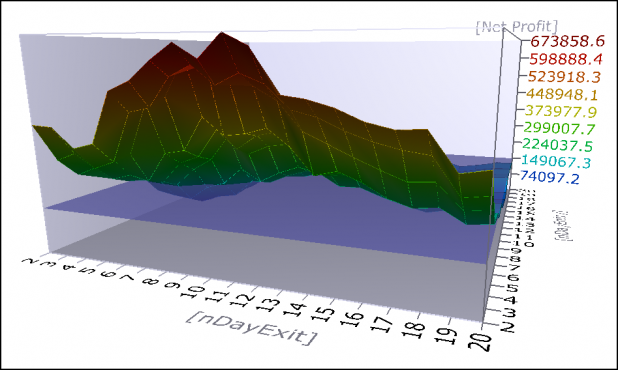
The above graph is the same as the first, but it has been rotated to show that the zone of profit for the nDayExit is large, and does not have a lot of individual spikes. Spikes can show areas where a variable does not provide robust results. The highest area represents the result of exiting longs on the highest close of the past 12 days and initiating shorts on the highest close of the past 12 days.

Again, same graph from behind. I included this view to clearly show how the exit days for longs (entry days for shorts) have a fairly large edge. The textbook 7 day high close exit is better than the 7 day low close entry.

Honestly, I’m very surprised by how large this edge appears to be. Granted, the optimizations were run over the entire data set, with no consideration given to in-sample or out-of-sample testing.

Bonus:

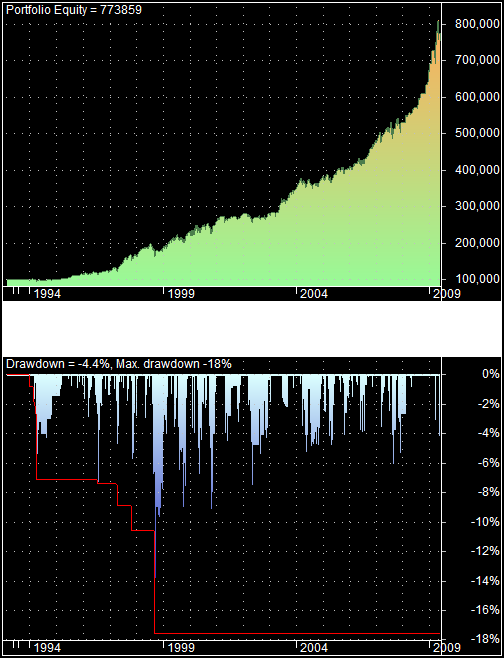
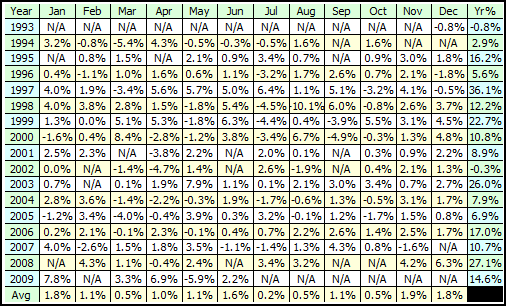
The latest beta version of AmiBroker includes an upgrade to the reports section. I’m going to include some of the charts it now generates automatically.

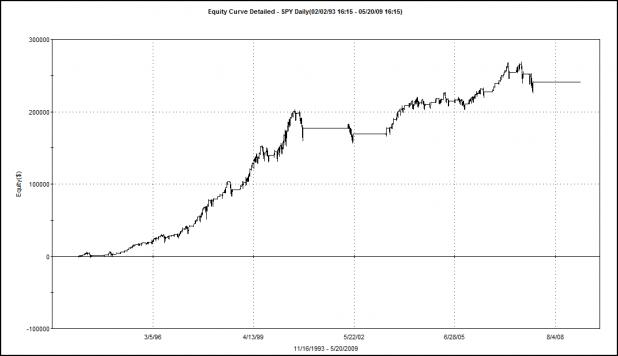
The more I look at this equity curve and drawdown profile, the more I like it! I am a little troubled by the curve going parabolic. How long can that profile be sustained?

The system has only lost money over 2 years (remember, the testing is frictionless).

I think that the next tests I run will attempt to use position-sizing and leverage to improve returns and decrease drawdowns. As much as I’d like to apply stops to the system, as Mikey found, there are not likely to be any stop strategies that can decrease risk without seriously limiting the performance. Instead, I’ll try to accomplish the same thing with dynamic position-sizing.

Comments »
Deconstructing the Double 7s: Let’s Short Something

I thought the above equity curve might capture some attention. I’ll explain how we get to that beauty in a bit.

Over the last few weeks, I’ve been Deconstructing the Double 7s, analyzing the system metrics, and hoping that there might be an improvement that can be made.

Mikey may have saved me some time with his comment:

MikeyTrades Says:

I tested 30+ different exits and exit combinations – time stops, % stops, time or 7DH stops, sell the next day after the signal (as opposed to the close), mvg avgs of the low or the close, W%R and ATR stop – before I ran out of time (this work was for a presentation to a small group of traders). The best stop was Sell the Close, the next best was an 8 day time stop, followed by Sell the Next day, 20 day time stop or 7DH, and then the 20 day time stop on its own.

Each of the five best exits had a normalized SQN (System Quality Number) above 2.0 that makes them tradeable according to Van Tharp to use position sizing to meet your objectives, but they are not ideal (for me anyway) as there is no downside stop with those time or 7DH stops.

Since I didn’t find any exits that I was comfortable with I didn’t move it into portfolio testing.

I have a feeling Mikey is no slouch when it comes to backtesting, so I’m thinking about trying one or two things that he didn’t write about trying.

But first, I’ve discussed adding a short component to the Double 7s, and its time to post the results.

Below are the results for the system with short trades, on the SPY, tested with the same settings as in the previous posts. The short trade is exactly opposite of the long trades. The ETF must be beneath the 200DMA. The highest close of 7 days will be sold short. The trade will be covered on the lowest 7 day close.

Double 7s, Shorts Added, on the SPY

Double 7s Equity Curve with Short Side Added

Comparisons Across ETFs, and Portfolio Results:

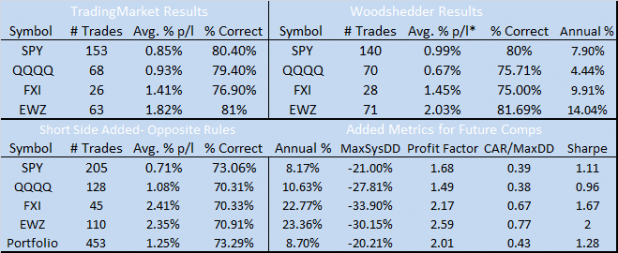
Some of the metrics may need explanation. MaxSysDD is the maximum system drawdown in percentage terms. CAR/MaxDD is the Annual % divided by the Maximum Drawdown. For example, if the system earned a compound annual rate of 20%, and the max drawdown is -10%, the CAR/MaxDD would be 2. The higher, the better.

For the portfolio backtesting, each ETF (SPY, Qs, FXI, EWZ) was allowed 25% of total equity.

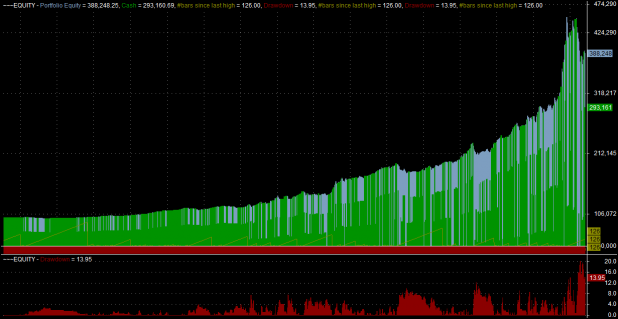
Portfolio Equity Curve:

Summary:

Adding the shorts increases the annual percentage in every ETF, but the SPY benefits the least from the addition. 2 of the other 3 ETFs double their annual returns when short trades are added.

I had hoped that drawdowns would be improved. While adding shorts smooths the equity curve, I’m not sure that they decrease the drawdowns.

Bonus:

One of the variables Mikey did not list as tested was changing the number of days used to calculate the entry and exits. The killer equity curve at the top of the post was generated by changing the system from a 7 day entry and exit to a 2 3 and 11 12 day system. For example, the system goes long at the lowest 2 3 day close and sells at the highest close of the past 11 12 days. It sells short at the highest close of the last 11 12 days and covers at the lowest 2 3 day close.

I’m curious if optimizing the n-day entry and exits is a viable strategy going forward. The next installment will look at these optimizations.

***Update*** Damian from Skill Analytics suspected that I had something incorrect, and he was right.  I used the overstrike function to fix the errors two paragraphs above this one. Without going into too much geekery, just suffice it to say that the code must be offset, and I had forgotten to take the offset into account. All other calculations appear to be correct.

Comments »

Deconstructing the Double 7s: TradingMarkets vs. Woodshedder

TradingMarkets does a good job of providing technical setups, as well as trader education services, with most of it available free-of-charge. Some of the recent publications from TradingMarket’s Larry Connors and authors Cesar Alvarez and David Penn promise simple yet profitable strategies. Indeed, as I found, the Double 7s does make money, although the test did not account for commissions or slippage.

The problem with the Double 7s strategy, traded over the SPY, is that it does not trade often enough to generate a substantial annual return. However, TradingMarkets lists three other ETFs that work well with this strategy. In fact, they mention most of the equity ETFs work well with the Double 7s. The solution to the lack of opportunity may be to trade the 7s across a portfolio of ETFs.

Here are the results as published in Connors’s book, vs. the results when I tested the strategy on the same ETFs.

*denotes data from AmiBroker platform. Tradestation results are used everywhere else.

Except for two places (SPY #Trades and QQQQ Avg. % p/l) the data derived from my testing is close to the results reported by TradingMarkets. I have a suspicion that TradingMarkets may have used the SPX 200 day average and applied it to the SPY, when the ETF was fewer than 200 days old. That may explain the 13 extra trades. The other difference in the #Trades seems to be due to subsequent strategy trading after publication of TradingMarkets results in 2008.

I did not determine why the AmiBroker Avg. % p/. results of 0.67% differs so greatly from TradingMarkets results of 0.93% for the Qs.

My main concern is that the system behaves as advertised, and it appears that it does.

The one detail not published about the Double 7s are equity curves. A strategy can be profitable and not be tradeable. The equity curve can help one determine if a profitable strategy is tradeable.

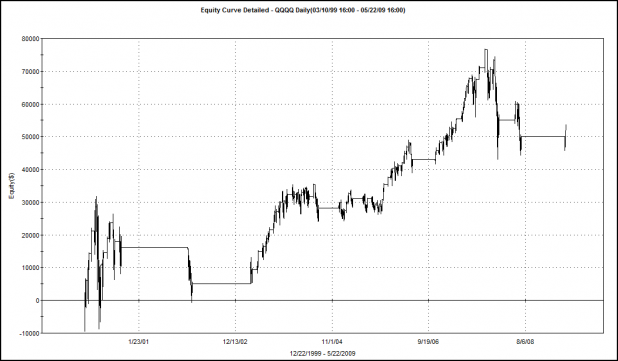
QQQQ Equity Curve

Not very pretty, or smooth… Notice the large drawdowns.

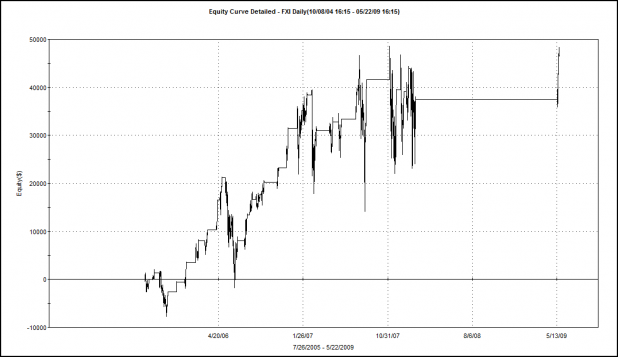
FXI Equity Curve

Note the huge drawdowns on FXI. One of the drawdowns was well over 50%. Again, not pretty, or smooth…

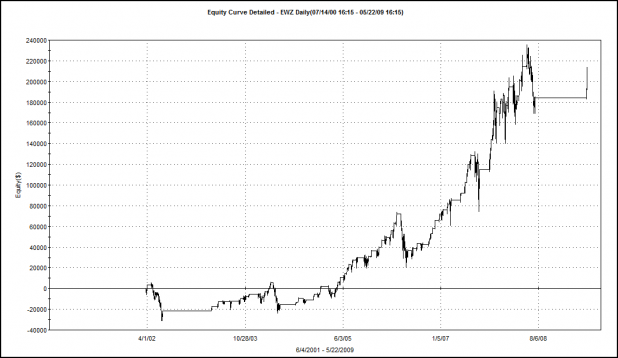
EWZ Equity Curve

The EWZ equity curve is a little better, there are several large drawdowns. One thing is for sure…this strategy likes to be traded over EWZ. The annual rate of return, when traded over EWZ is 14.10%, or almost double the return when the Double 7s is traded over the SPY.

What’s Next?

I have determined that results as reported by TradingMarkets can be replicated. However, the analysis has uncovered weaknesses in the strategy. These weaknesses have not been reported or discussed.

The first weakness is that the system does not trade often enough. By allowing the system to go short and trade a portfolio of ETFs, we can expect greater opportunity.

The second weakness is that the system, while profitable, may not be tradeable, due to the large drawdowns exposed within the equity curves.

Adding a short component to the system may smooth the equity curves. Also, allowing the system to trade a portfolio of ETFs may smooth the curve as well. We have to be careful though, assuming that the ETFs will trade independently of each other and smooth the curve, because as we saw in October and November 2008, all correlations became 1.

The next post will examine how adding short trades affects performance.

Comments »

Deconstructing the Double 7s: System Metrics

As mentioned in the previous post, running a backtest of the Double 7s system on different platforms exposed inconsistencies in the data used for the tests.

Comparing each platform’s trade-by-trade report shows that data provided by Norgate had 14 instances of prices that did not match the prices provided by Tradestation data. Many of these inconsistencies seemed to be caused by consecutive closes at the same price. There were 12 trades taken by Tradestation that were not taken by AmiBroker. Most of the errors were found in the first 2 years of trades.

While it is possible the code and settings for each platform are not exactly the same, after examining many of the trades in charts, the inconsistencies seem to extend from different data vendors. I do believe the code is working the same on both platforms, but that the data I’m using with the AmiBroker platform is different. I will probably email the vendor and inquire.

Alright, enough robot talk, here are the results:

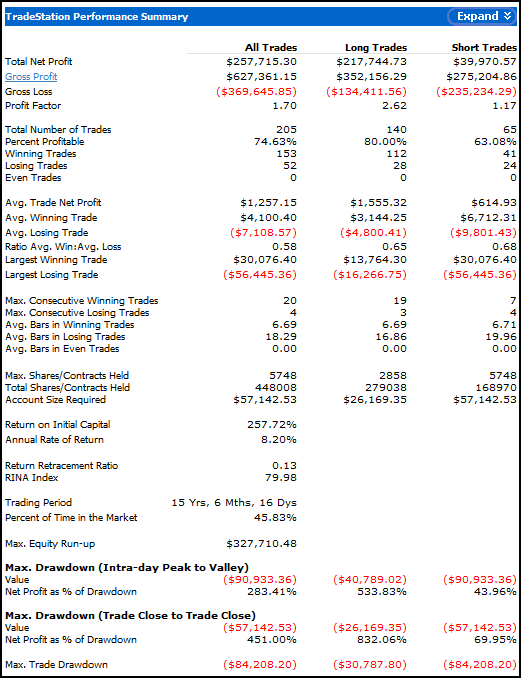
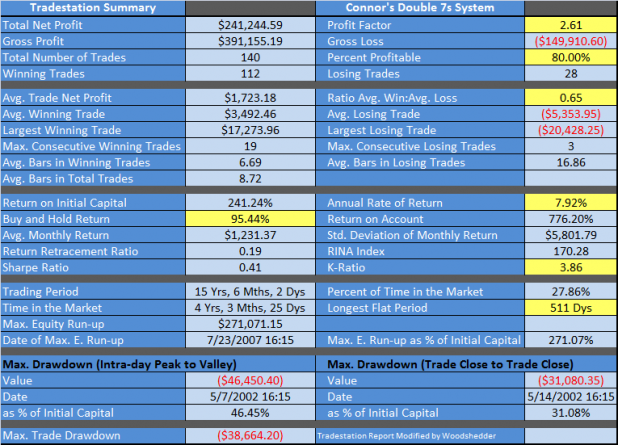
Tradestation Report:

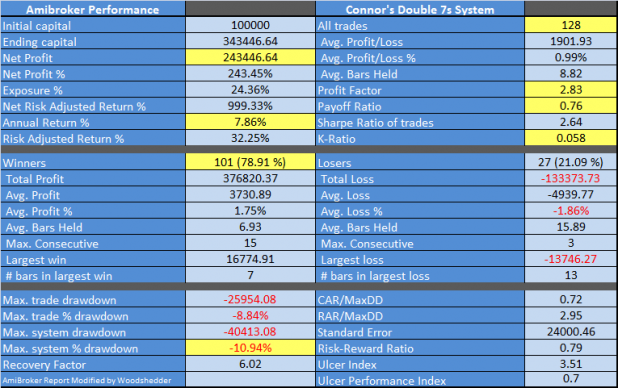
The metrics I find relevant or want to make mention of are highlighted in yellow. Because the system periodically shuts down when price dips beneath the 200 day average, it is somewhat restrained in terms of its ability to generate a large annual return. The system did more than double the buy-and-hold return.

Note the good profit factor, high win%, and high K-ratio.

The ratio of average win:average loss is a tad low,  and the last trade the system closed was on 11/28/07.

AmiBroker Report:

I like the AmiBroker report as it shows some key metrics in terms of percentages. When trading an index, it is important to calculate gains in percentages rather than dollar value as the percentages can be applied to projections of performance into the future.

Note the slight differences in some of the metrics. This is to be expected since the system traded fewer times and the data seemed to have some inconsistencies. Still, results are very similar, as we would hope they would be.

One of the metrics that AmiBroker includes in the default backtest report is Max. System % Drawdown. The Double 7s shows a -10.94% drawdown, which is decent, but with an annual % return less than the max system % drawdown, there is room for improvement.

Tradestation shows a max system % drawdown of 14%, which is almost double the annual return.

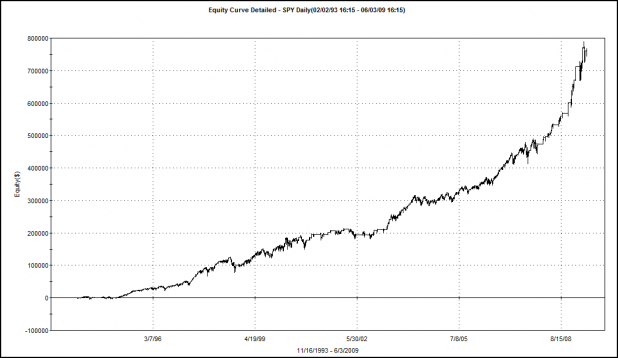
For the visually stimulated, here is the equity curve of the Double 7s, generated by the Tradestation data.

What’s Next?

Because I think it will be fun to compare my results, which were compiled on the same platform and theoretically with the same data, to the results published by TradingMarkets and Connors’s, that is what I will do next.

Once the comparison is out of the way, the tweaks, modifications, and optimizations will begin. I believe the easiest way to make the Double 7s earn more is to provide it more opportunities to earn. A simple way to increase opportunity is to let the system go short. Testing a short setup that is symmetrical to the long setup will likely be the first test I’ll run.

Comments »

Deconstructing the Double 7s: Demolition Day

Before breaking down the Double 7s, I should highlight a few features of the system. The rules can be expressed in 3 lines:

  1. The SPY is above its 200-day moving average.
  2. If the SPY closes at a 7-day low, buy the close.
  3. If the SPY closes at a 7-day high, sell your long position at the close.
  • The system is typical of an index mean-reversion model as it seeks to buy weakness and sell strength and does not use stops.
  • The system uses a trend-filter in the form of the 200-day moving average.
  • A system that uses the closing price to make a decision which is then executed at the close may be impossible to trade in real-time, meaning that any backtested results are not likely to be replicated.
  • The fact that the system does not short and will be out of the market for extended periods of time means that lack of opportunity is a probable limitation.

Testing Parameters:

Initial equity = 100K.

No commissions or slippage are included as they were not included in the results reported by Connors.

Gains are compounded with each trade using all available equity.

All available data for the SPY is used. Norgate provides the data for my AmiBroker platform. I think that CSI provides data for Tradestation, but I’m not certain about that.

The Results: (Not)

After reviewing the trade-by-trades as reported in AmiBroker and Tradestation, I’ve noted many discrepancies that will need to be sorted out before posting the results of the system. Most of the discrepancies seem to be due to inconsistencies in the data used by the platforms.

In the meantime, BZB Trader recently posted the metrics of his variation of the Double 7s: Qs Double 7s Update. For any statistics junkies, hopefully BZB will tide you over until I can finish.

I’ll get the results posted as soon as I can review all the data inconsistencies.

Comments »

Deconstructing the Double 7s

TradingMarkets describes the Double 7s as one of their “more effective ETF trading strategies…” As one would expect of a simple trading strategy published in a popular book, the Double 7s strategy has been discussed on various sites and in the blogosphere.

Other than Kirk Dolan’s report of his modifications, I have not found any other modifications or reports of any specific metrics generated by this strategy, beyond the few results reported in Short Term Trading Strategies….

Therefore, the Double 7s seems ripe for some deconstruction, to discover the system internals. Depending on what I find under the hood, I might then run some tests and add some tweaks in order to reconstruct an improved variation.

The Method:

Deconstruction will consist of running the exact strategy, as published in several places, in both Tradestation and AmiBroker to compare the current results with results as they were when the system was published. Running the strategy on two separate platforms and over two separate data vendors will ensure a robust comparison.

I will examine the system metrics in detail, to determine the strengths and weaknesses.

Finally, assuming the strategy is able to be improved upon, I will rebuild the strategy and then apply it over a large portfolio of ETFs, adding commissions and money management rules.

It should be instructive, and will hopefully be an enjoyable endeavor for the readers of this blog.

Comments »